This is Brian Wheeldon, Quest Solution Architect and "Dashboard Don" with a simple tutorial about how to build a useful dashboard in just a few minutes using the Foglight WCF definition editor. If you're not interested in learning more about how to build dashboards in Foglight, you can still download the LogFilter Summary dashboard cartridge from here.
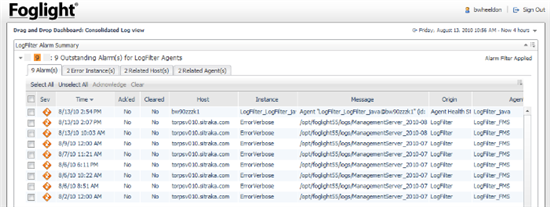
This is what the dashboard looks like:
Drag and Drop vs. WCF Dashboards
One of the nice things about Foglight is that you can easily create useful custom dashboards using drag and drop. For example: Building a geo drag and drop dashboard for a service and Fun with Foglight 5.5.4 - much easier now.
But drag and drop dashboard have some limitations. If you drag elements from the "Data" tab, you must select individual monitored elements to visualize. If you drag elements from the "Views" tab, you must select from pre-defined views that must provide their own built-in selection mechanism.
Sometimes you want to have a view that shows a metric for all elements of a given type, or that tells you the status of a dynamic set of agents. The key here is that you want the content of the view to change as your environment evolves, without needing to update the drag and drop dashboard each time you add a new host or agent.
In other words, you want a dashboard that is query-driven, rather than data-driven. Foglight provides a powerful framework for building query-driven dashboards that everyone can leverage called WCF, or Web Component Framework. Although it's more complicated than drag-and-drop custom dashboards, this framework is also much more powerful and flexible. Almost all the built-in dashboards and those shipped with in domain cartridges are built with WCF. The developers who create and maintain these cartridges use exactly the same tools that are available to you and every Foglight user.
Requirements
One of my Foglight customers wanted a consolidated view of all alerts generated from all the monitored log files in his environment. Although you can drag and drop an individual LogFilter agent on a custom dashboard, you'd need to drag all the agents manually onto a custom dashboard if you wanted to see all of them, and you have to maintain the dashboard as you add or remove monitored log files in the environment.
To easily manage all the log files in one place, we need a query-driven dashboard that will automatically update as the monitored
environment evolves. To implement that, we'll need to create a query and a dashboard using the Foglight WCF definition editor.
If you would like to work through this tutorial but haven't deployed any LogFilter agents yet, you can substitute any other agent type in the following steps.
Setup
In order to create sharable "System" dashboards, you must log onto Foglight as a user with the "Dashboard Designer" role. "Foglight Administrators" have this role by default, but others would need to have this role assigned to them by a "Foglight Security Administrator".
Once logged in as a "Dashboard Designer" we'll need to create a module that will contain our custom dashboard. Since WCF dashboards are query-driven rather than data-driven, WCF modules can be exported from one FMS and imported to another.
To create a new WCF System module, open the left navigation panel and select "Definitions" from the "Configuration" group under "Dashboards". In the top left pane of the Splitter window that appears, you will find a green "+" button at the bottom of the list. Click on this button to create a new system module. You will be prompted for a name for the module and you can optionally enter a description, logo, and Allowed Role(s) for the module. Make sure that you enter at least one Relevant Role for the module. I usually add Operator and Advanced Operator roles.
Modules can be nested. I created an "SA" module (for "Solution Architect") as the parent of a bunch of custom dashboard modules for different domains. I created a module called "SA: Log Summary" as a child of the "SA" module to store the log summary views.
Building a Query
Once we have a module to contain our dashboard, we're ready to start building. Select the module you just created in the top left pane and you will see a blank slate of dashboard elements in the bottom pane. You can add many types of elements including Functions, Renderers, Types, Tasks, Icons, Files and Mappings, but we'll stick to the basics: Queries and Views.
Although the WCF editors look pretty complicated, they are really just glorified XML editors. With a bit of practice you'll find they get easier to understand and work with. You don't need to understand every option to build good dashboards. You can get good results by using just a few basic properties as we do in this tutorial.
Select Queries from the dropdown list and click "Add" beside it.
FMS 5.5.8: From the "Create a Blank Query" tab, enter the object type that the query should return in the search field. In this case "LogFilterAgent".
Select that type from the filtered list and clidk OK.
Older FMS versions: From the "Create a Blank Query" tab, select "Foglight" and click OK. The WCF query editor will fill the right pane of the window.
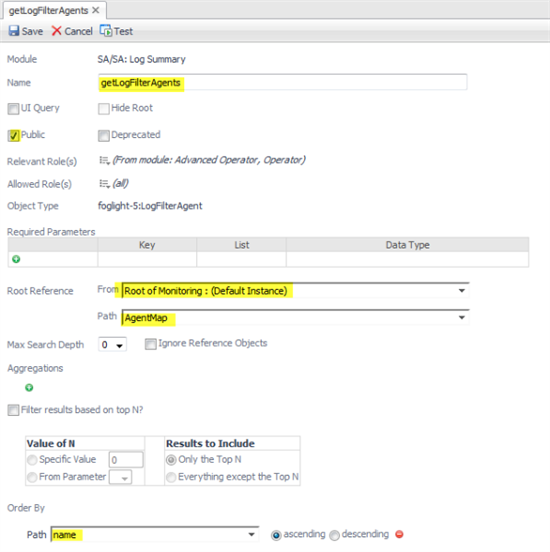
We want our query to return a list of all LogFilter agents.
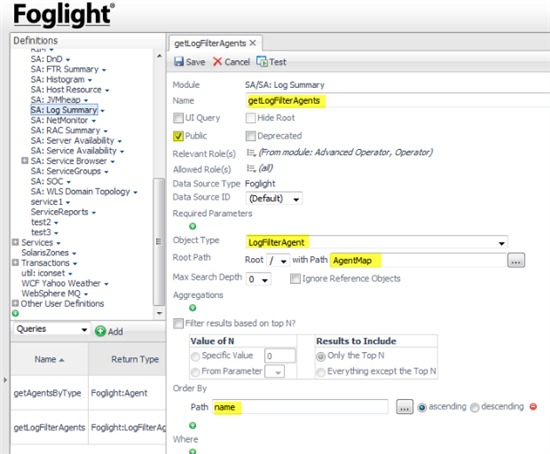
Specify the name of the query: getLogFilterAgents
Set the query to be "Public" so that it can be used by other modules.
Older FMS versions: Set the return Object Type to "LogFilterAgent" by selecting it from the dropdown list.
Tip: If you open a dropdown list and type the first few characters of the target type, the list will automatically scroll to the right area.
Next we need to configure the query to extract LogFilter agents from the Foglight model.
In this case it's easy: all agents are listed below /AgentMap
FMS 5.5.8: Select Root Reference: Monitoirng (Default Instance) and "AgentMap" in the Path dropdown.
Older FMS: Select "AgentMap" in the Path dropdown.
There are lots of options to aggregate, filter, order and limit the results, but none of these are necessary for our dashboard.
FMS 5.5.8 Screenshot
FMS 5.5.5 Screenshot:
Building the Dashboard
Now that we have our query, we can use it to populate our dashboard.
Select the "Views" group from the top of the lower left pane and click
"Add" beside it.
From the Create a Blank View tab, open Common and select "Grid Layout". Click OK. This will be our dashboard.
The tabbed editor for this new view will fill the right pane. The view properties are grouped into General, Context, Configuration,
Layout and Flow areas. We'll need to configure the General, Context and Layout.
General Tab
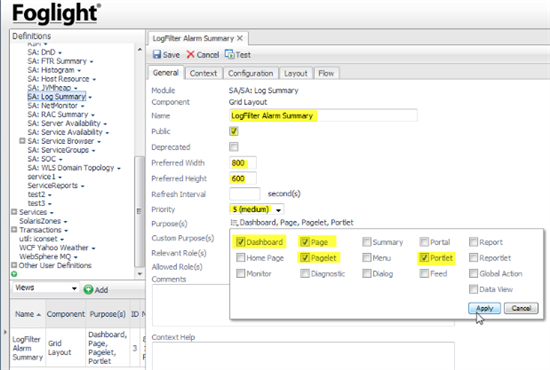
Starting with the General tab, set the Name of the view to something like "LogFilter Alarm Summary".
Unless we set a separate Title in the Configuration tab, the Name will be used to identify this dashboard/portlet.
Make this view Public so that it's visible to all users.
Set the Preferred Width and Preferred Height so that the view will have enough space if it is popped up in a new window.
Set the Priority to "5(medium)"
We want this view to be accessible as a Dashboard and a Portlet. We may also want to use it as a drilldown page or as part of a page, so enable the following Purposes: Dashboard, Page, Pagelet, and Portlet.
Context Tab
In the Context tab, we'll define the set of objects that this view will need to populate itself and fulfill the context requirements of the child view(s). Start by defining the Input context representing the set of LogFilter agents to display. Click on the green "+" button in the Inputs area and set the following fields:
Key=LogFilterAgents
Usage=Optional (we'll calculate this value if it's not provided by a
parent view)
List=true
DataType=Foglight:LogFilterAgent
Fallback Value=Query
In the Query Binding editor, click the "..." beside Query and navige to the query you created in the previous step in the module you created in the first step.

Now we have all the data required to populate our summary view. We will use a standard tabbed view to display all the alarms for our agent list. That view, 'Alarm List with Filter (TopologyObjects)' from the system module 'Alarms', requires an input context with a key called 'topologyObjects'. We've configured the context with a key called "LogFilterAgents", so we'll need to map our context to the context required by the child.
To do that, create a new "Additional" context by clicking the "+" button in the lower "Additional" context area. Set the Key to "topologyObjects" and the value to be the "LogFilterAgents" context.
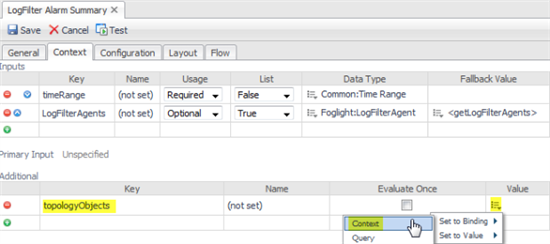
You could reasonably ask why we didn't use "topologyObjects" as the key in the Inputs section and avoid the extra step of creating the Additional context entry. That would work, but we want to demonstrate an important principle: the ability to rename, transform and derive context in one view and flow it to the next.
With the required context in place, we're ready to add the dashboard content view to this layout.
Layout Tab
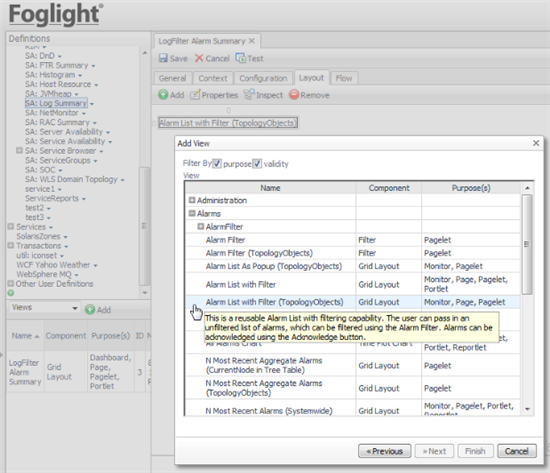
Select the Layout tab and click "Add". Use "Select existing view" andclick Next. Open the "Alarms" module and select "Alarm List with Filter (TopologyObjects)".
Click Next. This view requests a context value called "forLabel". Edit the Value field and Set to Binding "Localized String". In the editor, enter Localized String "LogFilter Agents".
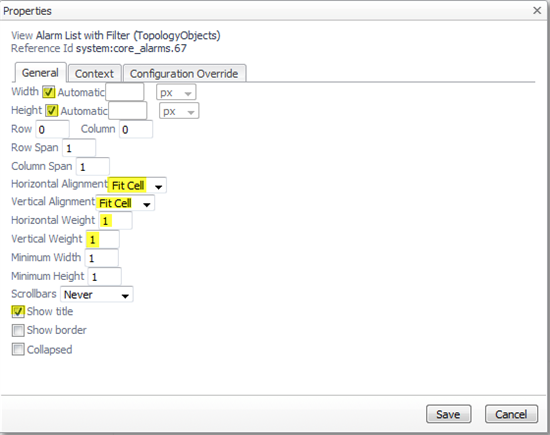
Finally, configure the placement of the child view:
Click Save.
Save the dashboard.
If you've done everything correctly, you should have a dashboard that looks like this in the summary view:
You can test your dashboard by clicking on the "Test" button (except in IE6).
You should now be able to select the dashboard from the left navigation pane, or drag and drop it from the View tab onto a custom dashboard.
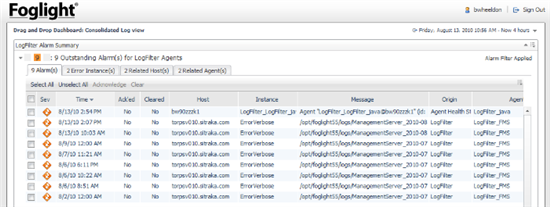
You can filter the agent list or use the tabs to organize the alarms into meaningful groups.
Dashboard Export and Import
If you're happy with your dashboard and want to export it to another FMS, you can use fglcmd and specify the zip file you want to export to and the module to export. You'll see the module name in the Reference Id field of the view. In the example above, the module name is "system:sa_salogsummary".
C:\Quest_Software\foglight5\bin> fglcmd.bat -srv 10.4.118.110 -port 8080 -usr foguser -pwd fogpwd123 -cmd util:uiexport -m system:sa_salogsummary -f C:\Temp\LogFilterSummaryDashboard.zip
Import the exported dashboard into a different FMS using something like:
$FOGLIGHT_HOME/bin/fglcmd.sh -srv 10.4.118.110 -port 8080 -usr foguser -pwd fogpwd123 -cmd util:uiimport -f LogFilterSummaryDashboard.zip
If you'd like to learn more about building WCF dashboards, you'll find some good tutorials in Foglight Help. In Using Foglight/Web
Component Framework/Web Component Tutorial, you'll find chapters for creating dashboards, drilldowns, reports, forms and more, as well as a WCF component reference guide.
That's all for now - please add a comment below if you find this article useful or are able to use this example as the basis for your own custom dashboard.
Happy dashboarding!
Other dashboards by Brian Wheeldon
Custom Dashboards for Device Availability metrics captured by the NetMonitor agent
Java Application Server JVM Summary dashboard
Custom Terminal Services Dashboard
Foglight 5.6 Infrastructure Host property dashboards and (re)portlets
(Please visit the site to view this file)


