• Products
    • View all products
    • Free trials
    • Buy online
    • Product lines
      • ApexSQL
      • Change Auditor
      • Enterprise Reporter
      • Foglight Database Monitoring
      • Foglight Evolve
      • KACE
      • Metalogix
      • Migration Manager
      • NetVault Backup
      • One Identity
      • QoreStor
      • Quest On Demand
      • Rapid Recovery
      • Recovery Manager
      • RemoteScan
      • SharePlex
      • Spotlight
      • Stat
      • Toad
    • Featured products
      • Cloud Management
        • Cloud Access Manager
        • Foglight for Virtualization, Enterprise Edition
        • Identity Manager
        • On Demand Migration for Email
        • Quest On Demand
        • Rapid Recovery
      • Data Protection
        • Foglight for Virtualization
        • NetVault
        • NetVault for Office 365
        • QorePortal
        • QoreStor
        • Rapid Recovery
        • vRanger
      • Database Management
        • Foglight for Databases
        • Litespeed for SQL Server
        • SharePlex
        • Spotlight SQL Server Enterprise
        • Toad Data Point
        • Toad DevOps Toolkit
        • Toad Edge
        • Toad for Oracle
        • Toad for SQL Server
      • Identity & Access Management
        • Active Roles
        • Defender
        • Identity Manager
        • Identity Manager Data Governance
        • One Identity Safeguard
        • Password Manager
        • Privileged Access Suite for Unix
        • Starling Connect
        • Starling Two-Factor Authentication
        • syslog-ng
      • Microsoft Platform Management
        • Active Administrator
        • Change Auditor
        • Enterprise Reporter
        • GPOADmin
        • InTrust
        • Metalogix
        • Migration Manager
        • On Demand Migration for Email
        • Quest On Demand
        • Recovery Manager
      • Performance Monitoring
        • Foglight Capacity Director
        • Foglight Hybrid Cloud Manager
        • Foglight for Databases
        • Foglight for Operating Systems
        • Foglight for Oracle
        • Foglight for PostgreSQL
        • Foglight for SQL Server
        • Foglight for Storage Management
        • Foglight for Virtualization
        • Spotlight on SQL Server
      • Unified Endpoint Management
        • Desktop Authority Management Suite
        • KACE Cloud Mobile Device Manager
        • KACE Desktop Authority
        • KACE Privilege Manager
        • KACE Systems Deployment Appliance
        • KACE Systems Management Appliance
        • RemoteScan
  • Solutions
    • View all Solutions
    • Industries
      • Education
      • Energy
      • Federal Government
      • Financial Services
      • Healthcare
      • State & Local Government
    • Platforms
      • Active Directory
      • Cisco
      • DB2
      • Exchange
      • Google
      • Hyper-v
      • Lotus Notes
      • OneDrive for Business
      • Office 365
      • Oracle
      • SAP/Sybase
      • SharePoint
      • SQL Server
      • Teams
      • Unix/Linux
      • VMware
      • Windows Server
    • Cloud Management
    • Data Protection
      • Overview
      • Backup & Recovery
      • Cloud Management
      • Deduplication & Compression
      • Disaster Recovery
      • Office 365 Data Protection
      • Virtualization Management
    • Database Management
      • Overview
      • Administration
      • Cloud Migration
      • Data Preparation and Provisioning
      • Development
      • DevOps
      • Performance Monitoring
      • Replication
      • Supported Platforms
        • IBM DB2
        • MySQL
        • Oracle
        • PostgreSQL
        • SAP Solutions
        • SQL Server
    • GDPR Compliance
    • Identity & Access Management
      • Overview
      • Identity Administration
      • Identity Governance
      • Privileged Access Management
      • AD Account Lifecycle Management
      • Access Control
      • Cloud
      • Log Management
    • Microsoft Platform Management
      • Overview
      • Mergers & Acquisitions
      • Migration & Consolidation
      • Office 365 Migration & Management
      • Security & Compliance
      • Windows Backup & Recovery
      • Supported Platforms
        • Active Directory
        • Cisco
        • Exchange
        • Google
        • Groupwise
        • Lotus Notes
        • Office 365
        • OneDrive for Business
        • SharePoint
        • SQL Server
        • Teams
        • Unix/Linux
        • Windows Server
    • Performance Monitoring
      • Overview
      • Database Performance Monitoring
      • Operating System Monitoring
      • Storage Performance & Utilization Management
      • Supported Platforms
        • Active Directory
        • DB2
        • Exchange
        • Java
        • Hyper-V
        • .NET
        • Oracle
        • SAP/Sybase
        • Storage
        • SQL Server
        • VMware
    • Unified Endpoint Management
      • Overview
      • Endpoint Compliance
      • Endpoint Security
      • Endpoint Visibility
      • Industries
        • Education
        • Healthcare
      • Supported Platforms
        • Internet of things
        • Microsoft® Windows
        • MAC
        • UNIX/LinuX
  • Resources
    • Blogs
      • Data Protection
      • Database Management
      • IT industry Insights
      • IT Ninja
      • Microsoft Platform Management
      • Performance Monitoring
      • Toad World Blog
      • Unified Endpoint Management
    • Customer Stories
    • Documents
    • Events
    • Webcasts
    • Technical Documentation
    • Videos
    • Whitepapers
  • Trials
  • Services
    • Consulting Services
      • Overview
      • Microsoft Platform Services
      • Data Protection Services
      • Unified Endpoint Management
      • Performance Monitoring Services
      • Database Management Services
    • Educational Services
    • Support Services
  • Support
    • Support Home
    • By Product
      • All Products
      • AppAssure
      • Archive Manager
      • Change Auditor
      • Desktop Authority
      • DR Series
      • Foglight
      • KACE
      • Migration Manager
      • NetVault
      • Rapid Recovery
      • SharePlex
      • Toad
      • vRanger
    • Contact Support
      • Overview
      • Customer Service
      • Licensing Assistance
      • Renewal Assistance
      • Technical Support
    • Download Software
    • Knowledge Base
    • My Account
      • My Products
      • My Service Requests
      • My Licenses
      • My Groups
      • My Profile
    • Policies & Procedures
    • Consulting Services
      • Microsoft Platform Management
      • Data Protection
      • Unified Endpoint Management
      • Performance Monitoring
      • Database Management
    • Technical Documentation
    • Educational Services
    • User Forums
    • Video Tutorials
  • Partners
    • Overview
    • Partner Circle Log In
    • Become a Partner
    • Find a Partner
    • Partner Community
  • Blogs
    • IT Industry Insights
    • Quest Solution Blogs
      • Data Protection
      • Database Management
      • ITNinja
      • Microsoft Platform Management
      • Performance Monitoring
      • Toad World Blog
      • Unified Endpoint Management
  • Forums
  • 製品情報
    • すべての製品情報を見る
    • Change Auditor
    • Foglight
    • KACE
    • Metalogix
    • Migration Manager
    • Migrator for Notes to SharePoint
    • NetVault Backup
    • On Demand Migration for Email
    • QoreStor
    • Rapid Recovery
    • Recovery Manager
    • SharePlex
    • Spotlight
    • Toad
  • ソリューション
    • すべてのプラットフォームを見る
    • クラウド管理
    • GDPRコンプライアンス
    • データ保護
      • 概要
      • クラウド管理
      • ディザスタリカバリ
      • バックアップとリカバリ
      • Office 365 データ保護
      • 仮想化管理
      • 重複除外と複製
    • データベース管理
      • 概要
      • DevOps
      • データの準備と分析
      • データベースのクラウド移行
      • データベースパフォーマンス監視
      • データベース管理
      • データベース複製ソフトウェアツール
    • 統合エンドポイント管理
      • 概要
      • エンドポイントコンプライアンス
      • エンドポイントセキュリティ
      • エンドポイントの可視化
    • Microsoftプラットフォーム管理
      • 概要
      • ハイブリッドActive Directoryのセキュリティとガバナンス
      • Microsoftプラットフォームの移行計画と統合
      • セキュリティとコンプライアンス
      • 情報アーカイブおよびストレージ管理ソリューション
      • Windowsのバックアップとリカバリ
      • Microsoft Serverのパフォーマンスと可用性
      • レポート作成機能
      • グループポリシーと権限
    • パフォーマンス監視
  • サービス
    • コンサルティングサービス
      • 概要
      • Microsoftプラットフォーム管理
      • データ保護
      • 統合エンドポイント管理
      • パフォーマンス監視
      • データベース管理
    • トレーニングと認定資格
    • サポートサービス
  • サポート
    • サポートホーム
    • 製品で検索
      • All Products
      • AppAssure
      • Archive Manager
      • Change Auditor
      • Desktop Authority
      • DR Series
      • Foglight
      • KACE
      • Migration Manager
      • NetVault
      • Rapid Recovery
      • SharePlex
      • Toad
      • vRanger
    • お問い合わせ
      • すべて
      • カスタマサービス
      • ライセンス アシスタンス
      • 更新のアシスタンス
      • 技術サポート
    • コミュニティフォーラム
    • ソフトウェアのダウンロード
    • ナレッジベ%E3%83%BCス
    • マイアカウント
      • マイ プロダクト
      • Myサービスリクエスト
      • マイ ライセンス
      • マイ グループ
      • マイ プロファイル
    • ポリシーおよび手順
    • コンサルティングサービス
      • Microsoftプラットフォーム管理
      • データ保護
      • 統合エンドポイント管理
      • パフォーマンス監視
      • データベース管理
    • リリースノートおよびガイド
    • 教育サービス
    • ビデオチュートリアル
  • トライアル
  • パートナー
    • 概要
    • Partner Circleへのログイン
    • パートナーになる
    • Find a Partner
    • パートナーコミュニティ
  • コミュニティ
Quest Community
Quest Community
  • Site
  • User
  • Site
  • Search
  • User
Foglight
Foglight
Foglight Administrators Custom Script Agent 4: Add a Metric to a Table
  • Forum
  • Wikis
  • Sub-Groups
  • More
  • Cancel
  • New
  • -Foglight Administrators
    • A New Foglight Service Status Widget - Text with Colored Background
    • Adding APM views to an existing Foglight Java cartridge installation
    • Adventures in Agent Creation - Part 1
    • Adventures in Agent Creation - Part 2
    • Adventures in Agent Creation - Part 3
    • Anonymizing the Foglight End User Monitoring Solution
    • Another Foglight Service Status Widget - Colored Text
    • Building a custom dashboard to summarize LogFilter alarms
    • Building a geo drag and drop Foglight dashboard for a service
    • Building Complex Schedules with Foglight
    • Busting Frame Busters in Foglight Experience Viewer (FxV)
    • Community Cartridge: Notification Management Cartridge
    • Compatibility for Navigation Timing API
    • Configuring Internet Explorer 9 (IE9), to best work with Foglight
    • Converting Foglight 4 Script Agents to Foglight 5
    • Creating Load Testing Scripts from FxM and FxV Session Data
    • Custom Agents - Introduction to Script Agents
    • Custom Agents - Script Agent Data Modeling and Units
    • Custom Foglight Dashboards: adding alarm colors to spinners, jelly beans and other gauges
    • Custom Script Agent 1: Leverage an Existing Monitoring Script To Push Data into Foglight
    • Custom Script Agent 2: Build a WCF Dashboard to View the Custom Agent Data
    • Custom Script Agent 3: Add a Metric and Build a WCF Chart to Display it
    • Custom Script Agent 4: Add a Metric to a Table
    • Customizing Foglight – Expert Services Discount Available for a Limited Time!
    • Customizing the out-of-the-box Host Status view
    • Dashboard speed-up
    • Deploying Two FglAMs to the Same Windows Host and running each as a Windows Service
    • Different Thresholds for Different Tablespaces
    • Different Thresholds for Different Tablespaces - Part 2
    • Emailing reports with the proper name and format
    • FGL IDE (Export Customizations & more)
    • Flexible, Cost-effective Remote Administration Services
    • Foglight 5 - Topology Localization
    • Foglight Advanced Administration Training - Limited Space for February 2012
    • Foglight APM Basics (Videos)
    • Foglight APM Features (videos)
    • +Foglight Best Practices
    • Foglight Best Practices (videos)
    • Foglight Best Practices Monthly Webcast – Sign Up for Session 1!
    • Foglight Best Practices: Dashboards and Reports Webcast Registration Open Now!
    • Foglight dashboard as a SharePoint WebPart
    • Foglight Dev Camp & Hackathon 2017
    • Foglight End User Management: Using Network TAPs versus a Switch SPAN Port
    • Foglight End User Service Availability Reporting, Foglight Experience Monitor or Foglight Transaction Recorder which one to use?
    • Foglight Event Synchronization Solution for HP Operations Manager Services Pack Available Now!
    • Foglight Experience Viewer (FxV) URL Search Shortcuts
    • Foglight Host OS Monitoring (videos)
    • Foglight iGoogle Gadget
    • Foglight nologinuser dashboard in SharePoint
    • Foglight Public Virtual Training Courses
    • Foglight Quickstart Services Offering
    • Foglight Reporting using Metric Queries or Groovy
    • Foglight Training Classes -- Public and Private Options Available
    • Foglight Training Packages with Free Healthcheck Services - Limited Time Offer
    • Fraud Support with FxV
    • FxM and Apache Proxy Server (X-Forwarded-Host)
    • FxM: IP Multicasting and Sessionizing
    • FxV Storage Tier Expansion & Analysis Repository Considerations
    • Getting the most out of Foglight's .NET Monitoring - Part 1
    • Getting the most out of Foglight's .NET Monitoring - Part 2: Agent Configuration Specifics and Best Practices
    • Getting the most out of Foglight's .NET Monitoring - Part 3: Monitoring a .NET Executable Application
    • HDIDT - View an Exported Real User Session File
    • How are your Java components processing?
    • How to Handle NTLM within UEM
    • Improve Organizational Adoption of Your APM Solution
    • January Foglight Best Practices Thursday, January 5 - Register Now!
    • Java APM
    • June 2012 Best Practices Webcast Open for Registration!
    • Migrating your Foglight Management Server
    • Monitoring .NET Request Memory Usage with Foglight
    • Monitoring an independent Java process using Foglight
    • Monitoring application availability using Foglight Utility Agents
    • New Foglight Services Packs Available
    • New Sizing Guide for FxM and FxV
    • New UEM Sizing Guide
    • Predicting the Impact of Moving a Guest to Another Host
    • +Quest Application Performance Monitoring (APM) Implementation Methodology
    • Reading a XML File with a powershell script agent
    • Really Simple (Foglight) Syndication
    • Services Section of Quest.com Gets a Facelift
    • Setting the value of a Registry Variable from the Command Line
    • SNMP trap variables in Foglight Alarms
    • The End-User as an Instrument...
    • Thoughts from the road - Foglight Java agent Tag and Follow
    • Thoughts from the road – User session replay - YOU CAN ACTUALLY DO THAT???
    • Training Update - New Foglight Reporting Course Available
    • Understanding Foglight Metrics
    • Updates to Quest's Foglight Public Virtual Training Calendar
    • Use a Foglight to monitor itself
    • Use Foglight to Drive Business Performance
    • Use Foglight to monitor itself
    • User Experience Mgmt Overview
    • Using telnet or wget to check connectivity
    • Using the ConfigService API to setup agent properties (ASPs)
    • Utilizing MS Exchange distribution lists to help with user attribute maintenance
    • We've Redesigned SupportLink to Get You Answers Faster Than Ever - See for Yourself and Enter to Win an iPad!
    • [Case Scenario] - How to avoid duplicate rows when building a report with 5 min granular data
  • (iNdOrE) && (GwAlIoR) +91-9915786526 ##LoVe Marriage Specialist Pandit ji kota
  • Custom Script Agent - Counting Files in a Windows Folder - How-To
  • Foglight Admin 101
  • Foglight monitoring application components running on Docker Containers
  • Foglight User 101
  • Memory Utilization for all processes over X months
  • NetMonitor - Quick How-To Guide
  • Setting JBoss Server name and domain in Foglight
  • Setting Tomcat server name and domain in Foglight
  • testing a bug - Do not publish
  • WebMonitor - Quick How-To Guide
  • WebMonitor agent installation

Custom Script Agent 4: Add a Metric to a Table

Building on the previous installments of this custom agent series, Quest Principal Solutions Architect Brian Wheeldon steps through the process of adding multiple aspects of a metric to a WCF table and defining a multi-line header, pointing out best practices along the way.

Requirements

After defining a custom metric and configuring a chart to display the metric, we'd like add this metric to the custom table we defined in episode two. We'd like to be able to visualize several aspects of this metric, including the current value, period average and trend. The table should present these distinct metric as a logical group. These columns should be sortable so that the highest network latencies appear at the top of the table.

Table Metric Design

We defined a WCF table to display the host, port and message returned by our custom agent in episode two of this series.

Now that we have a metric to measure the network latency between the source and the target port, we'd like to display that metric in the table.

We'd like to expose several aspects of this table so that it's easy to determine at a glance which connections are consistently slow or intermittently slow. To do this, we'll display three different aspects of this metric: the trend, current value, and period average. We'll also like to be able to see the worst case network latency for this metric, but this aspect should be hidden by default to avoid cluttering the display.

For a briefing about these different aspects of a metric, see Understanding Foglight Metrics.

We'll define column groupings so that these metric values appear in a logical group.

Configure a metric in a WCF Table

Although these steps directly build on our custom agent example, the same principle can be applied to adding any metric to any WCF table.

As a user with the "Dashboard Designer" role, open the Configuration group under Dashboards and select Definitions.

Select the working module in the top left window. In this tutorial, we'll build on the custom port monitor agent dashboards in the "TCPcheck" module.

Select the target table: "TCP Check Table" in the bottom left pane so that the summary of this table appears in the main working area. Click Edit.

Select the Configuration tab.

Add a "Trend" (sparkline) column

In this section, we'll configure a column to visualize the trend of the metric using a sparkline. A sparkline is a "data-intense, design-simple, word-sized graphic" invented by data visualization pioneer Edward Tufte.

We'll also define the separate metric aspect that will be used when this column is sorted.his column.
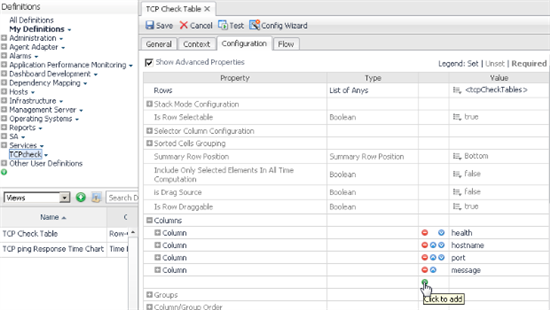
Open Columns

Click the "+" button at the bottom of the Column list

Click the edit button in the Value row. Select Context.

Click the drop down beside Input Key. Select the item representing the object for this row: currentRow (tcp_check_Agent_Table_TCP_CHECK)

The aspect we want is the average value of the metric over the selected time range shown in the current page.

Click in the drop down beside Path. Open the target metric: responseTime. Open Period. Select Average - Double

The Path field will populate with "responseTime/period/average". Click Set.

The table will use this aspect of the metric to sort the table.

Next configure a sparkline visualization to represent the trend of this metric.

Click the edit button in the Render Value row. Select Context.

Click the drop down beside Input Key. Select the item representing the object for this row: currentRow (tcp_check_Agent_Table_TCP_CHECK)

Click in the drop down beside Path. Select the target metric: responseTime - Metric

Click the edit button beside Renderer.

In the Select a Renderer dialog, Open Management Server. Open System. Select "Time Plot Renderer". Click Save.

Click Set.

Next, we will identify this column:

Click the edit button beside ID. Enter something like "responseTimeTrend". Click Set.

Label this column:

Click the edit button beside Header. Select Set To Binding>Localized String.

In the Edit - Header dialog, enter "Trend" in the Localized String field. Click Set.

Right-align the column:

Open Cell Alignment. Click the edit button beside Horizontal. Select Right.

Best Practice: Right align numeric columns. Left align text columns. Center align icons.

Specify the default sort direction for this column:

Click the edit button beside Current Sort Order. Select Descending.

Best Practice: Set the Default sort direction of text columns to Ascending. The Default sort direction for most metric columns and all alarm value columns should be Descending. The default sort direction of a a column should move the most interesting (largest) values to the top of the table.

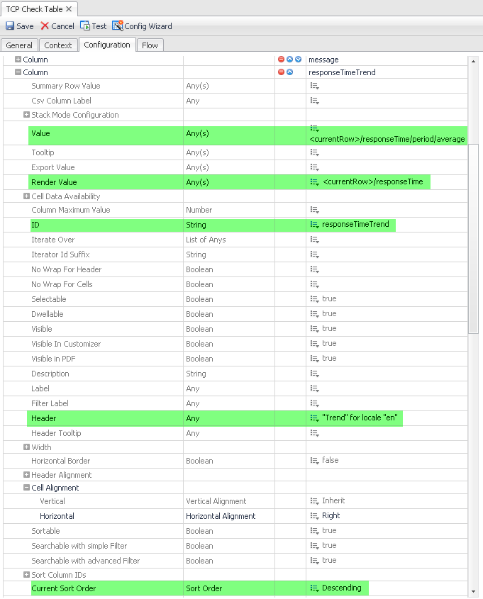
All the other column values can be left to their default values. The table column you just configured should look something like:

Click the Save button at the top of the page to save "TCP Check Table".

Test the table by using the the Test button at the top of the page, or by opening a new browser window/tab from the right Action Table "New window" option, and navigating to the TCPcheck/TCP Check Table dashboard. Verify the "Trend" column.

Add a "Current" value column

Return to the Definition editor and edit the table once again. Select the Configuration tab.

Click the gray "-" button to the left of the last column group to hide (not delete!) the column you just created.

Click the "+" button at the bottom of the Column list to add a new column.

Click the edit button in the Value row. Select Context.

Click the drop down beside Input Key. Select the item representing the object for this row: currentRow (tcp_check_Agent_Table_TCP_CHECK)

The aspect we want is the current value of the metric for the selected time range.

Click in the drop down beside Path. Open the target metric: responseTime. Open Current. Select Average - Double

The Path field will populate with "responseTime/current/average".

Click the edit button beside Renderer. Open Management Server. Open System. Scroll down to select "Number: 2 Decimals". Click Save.

As you can see, there are a lot of predefined options for displaying metrics.

Click Set.

This time we don't need to specify a separate Render Value. The value we just defined is suitable for both display and sorting.

Identify this column:

Click the edit button beside ID. Enter something like "responseTimeCurrent". Click Set.

Label this column:

Click ther edit button beside Header. Select Set To Binding>Localized String.

In the Edit - Header dialog, enter "Current" in the Localized String field. Click Set.

Right-align the column

Open Cell Alignment. Click the edit button beside Horizontal. Select Right.

Specify the default sort direction for this column:

Click the edit button beside Current Sort Order. Select Descending.

Add a "Period Average" value column

Click the "+" button at the bottom of the Column list to add a new column.

Click the edit button in the Value row. Select Context.

Click the drop down beside Input Key. Select the item representing the object for this row: currentRow (tcp_check_Agent_Table_TCP_CHECK)

The aspect we want is the current value of the metric for the selected time range.

Click in the drop down beside Path. Open the target metric: responseTime. Open Period. Select Average - Double

The Path field will populate with "responseTime/period/average".

Click the edit button beside Renderer. Open Management Server. Open System. Scroll down to select "Number: 2 Decimals". Click Save.

Click Set.

Identify this column:

Click the edit button beside ID. Enter something like "responseTimePeriodAverage". Click Set.

Label this column:

Click the edit button beside Header. Select Set To Binding>Localized String.

In the Edit - Header dialog, enter "Average" in the Localized String field. Click Set.

Add a tooltip to this column:

Click the edit button beside Header Tooltip. Select Set To Binding>Localized String.

In the Edit - Header dialog, enter "Period Average" in the Localized String field. Click Set

Best Practice: Keep column headings brief, but define more descriptive column header tooltips so users can learn more by resting their mouse on the column header.

Right-align the column

Open Cell Alignment. Click the edit button beside Horizontal. Select Right.

Specify the default sort direction for this column:

Click the edit button beside Current Sort Order. Select Descending.

It's time to validate your configuration again. Test your configuration using the Test button or a separate browser tab/window.

Define nested column headings

Next we want to tune the table by adding a logical grouping for these metric aspects.

Edit the TCP Check Table once again and select the Configuration tab.

Click the "-" button to the left of Columns to hide all the columns you just defined.

Open Groups. Click the "+" below Groups to add a group.

Label the group:

Click the edit button in the Header row. Select Set to Binding>Localized String.

In the Edit - Header dialog, enter "Response Time" in the Localized String field. Click Set.

Define the column IDs that belong in this group:

Open "Column/Group Order". Click "+" to add a column to this group.

Click the edit button for the first column. Enter the first column ID: "responseTimeTrend". Click Set.

Click "+" to add another column to this group.

Click the edit button for the second column. Enter the second column ID: "responseTimeCurrent". Click Set.

Click "+" to add another column to this group.

Click the edit button for the third column. Enter the third column ID: "responseTimePeriodAverage". Click Set.

Click the edit button beside ID. Enter something like "responseTimeGroup". Click Set.

Now there is a two level header for the Response Time metric columns.

Define the Column/Group Order

We'll be using the ID values configured previously for each column and group to order them.

Open "Column/Group Order".

Click "+" to specify the first column or group to display in this table.

Click the edit button for the first column. Enter the first column ID: "health". Click Set.

Click "+" to add the next column to this group.

Click the edit button for the second column. Enter the second column ID: "hostname". Click Set.

Click "+" to add the next column to this group.

Click the edit button for the third column. Enter the third column ID: "port". Click Set.

Click "+" to add the next group to this group.

Click the edit button for the forth group. Enter the group column ID: "responseTimeGroup". Click Set.

Click "+" to add the next column to this group.

Click the edit button for the fifth column. Enter the third column ID: "message". Click Set.

Best Practice: If you want the columns to appear in a different order than they are specified in the Columns group, configure the "Column/Group Order".

Save and Test the table.

Define a custom Renderer

That looks pretty good, but let's refine the way that the trend line looks.

We'll make a copy of the System renderer and customize it.

Best Practice: There are plenty of pre-defined views and renderers that you can use in your dashboard directly, but don't be afraid to make a copy of one that's close but not exactly right, then tune the copy it to make it your own. Never modify a pre-defined System view or renderer. Instead copy it to your working module and modify the copied version.

Return to the WCF Definition Editor.

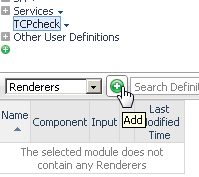
With the current module "TCPcheck" selected, change the "Views" dropdown to "Renderers"

Click the "+" button beside "Renderers" to add a renderer.

Select the "Copy an Existing Renderer" tab.

Open Management Server/System. Scroll down and select "Time Plot Renderer".

The copied renderer now appears in the edit window.

Change the Name to "Sparkline".

Uncheck "Public".

Best Practice: Only views that are marked as "Public" can be used in other modules. Public views cannot be deleted, only replaced. In your custom dashboard modules, avoid setting the "Public" property unless you actually plan to use this view in other modules.

Select the Configuration tab.

Change the Height from 20 to 13.

Change Mark Current Point to true.

Open "Sparkline" at the bottom.

Change Line Thickness to "Automatic (Default)"

Save this Sparkline renderer.

Now modify the table to use the Sparkline you just defined.

Edit TCP Check Table and open the Configuration tab.

In the Columns group, open the responseTimeTrend column

Edit the Render Value field.

In the Edit - Render Value editor, click the edit button in the Renderer field.

Replace the System Renderer with the tuned Sparkline Renderer you just configured:

Open TCPcheck. Select "Sparkline". Click Save.

Click Set.

Save TCP Check Table.

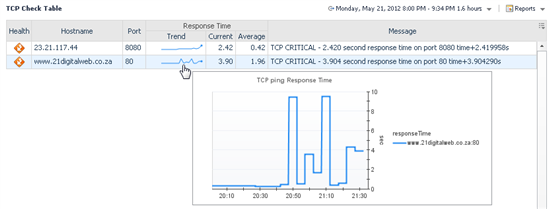
Test the table. Does the trend line look better?

Exercise: Add a new column representing the worst case ping time for the metric: responseTime/period/maximum

Make sure that it's identified and grouped with the other metric visualizations, and is aligned and sorted properly.

Change the "Visibility" of this column to "false" so that it can be exposed on demand from the edit menu in the top right of the table, but is hidden by default.

Test toggling the visibility of this column by clicking on the edit icon on the top right of the dashboard table.

You now have a sophisticated tabular display of the custom agent data, including visualizations for several different aspects of the target metric and a custom sparkline Renderer.

If you have questions or comments about this article, please add them below. More general questions about building dashboards can be posted in the Custom Dashboards & Scripts Discussion forum.

Stay tuned for the next installment of this custom agent series, when we'll cover the configuration and use of agent properties in script agents.

  • custom dashboard
  • metric
  • edward tufte
  • wcf
  • sparkline
  • table
  • Share
  • History
  • More
  • Cancel
Related
Recommended
  • Company
    • About Us
    • Buy
    • Contact Us
    • Careers
    • News
  • Resources
    • Industry Insights Blog
    • Communities
    • Customer Stories
    • Documents
    • Events
  • Support
    • Professional Services
    • Renew Support
    • Technical Support
    • Training & Certification
    • Support Services
  • Social Networks
    • Facebook
    • LinkedIn
    • Twitter
    • YouTube
  • © 2023 Quest Software Inc. ALL RIGHTS RESERVED.
  • Legal
  • Terms of Use
  • Privacy
  • Community Feedback & Support
  • Cookie Preference Center
  • 会社名
    • 会社情報
    • 購入
    • お問い合わせ
    • 採用情報
    • ニュース
  • リソース
    • ブログ
    • お客様の事例
    • ドキュメント
    • イベント
    • ビデオ
  • サポート
    • プロフェッショナルサービス
    • サポートの更新
    • テクニカルサポート
    • トレーニングと認定資格
    • サポートサービス
  • ソーシャルネットワーク
    • Facebook
    • Instagram
    • LinkedIn
    • Twitter
    • YouTube
  • © 2023 Quest Software Inc. ALL RIGHTS RESERVED.
  • 「法務」
  • ご利用規約
  • 個人情報保護方針
  • コミュニティのフィードバックとサポート