
In the previous installments of this series, Quest Principal Solutions Architect Brian Wheeldon created a custom script agent to push data into Foglight, configured a rule, and constructed a WCF dashboard for the custom agent data. In this segment, he steps through the process of adding a custom metric and displaying it in the WCF dashboard, highlighting best practices along the way.
Requirements
After deploying and activating a script agent, configuring a rule to trigger an alert if the agent indicates a problem, and building a basic dashboard to visualize the agent data, basic monitoring is in place. Now we'd like to improve the capabilities of the agent.
The script agent generates an informative message each time it runs. The message looks like: "TCP OK - 0.018 second response time on port 8080 time+0.018177s". With the response time of the TCP ping available in each observation, wouldn't it be nice to chart that value over time? That would allow us to detect trends over time and report on the network performance.
We'd also like to see this metric displayed in the custom agent table we created previously.
Two Ways to Create a Metric
In order to visualize the response time value over time, we need to convert these observations into a Metric in Foglight. The Metric type consists of a list of historical observations and aggregate observation data for various time ranges. Each observation includes a start time, an end time, maximum, minimum and average values, the sum of these values, the sum of squares of these values, and the standard deviation of these values. Foglight will automatically calculate these observation structures given the value of the observation at each sample.
There are two ways that this intermittent value can be pushed into the Foglight model. Configuring the agent to report this value is the most common way. FglAM (Foglight Agent Manager, or DevKit) agents do this by populating a Java data structure and periodically submitting it to the FMS. Script agent do this by writing a line like this to stdout:
responseTime:seconds=0.018177
The second approach is to configure a derived metric. Derived metrics are calculated on the FMS (Foglight Management Server) based on raw data submitted by agents. Once calculated, derived metrics are indistinguishable from raw metrics and may be used in rules, dashboards, reports etc. just like raw metrics. Common examples of derived metrics are sum or average of many raw metrics, and the sums or average of an existing metric over specific time ranges.
For our custom script agent based on a Windows "check_tcp.exe" monitoring script, we could implement either of these approaches.
The syntax for parsing the response time in a Windows script turns out to be somewhat arcane.
Recall that the tcp_check.bat script that wraps the raw monitoring script has:
@rem replace '=' to avoid a StringObservation parse error
FOR /F "tokens=1,2 delims=(=" %%A IN ("%_result%") DO SET _result1=%%A+%%B
The best way I could find to pull the value out of the %_result1% environment variable is:
@rem Parse the response time
FOR /F "tokens=2 delims=+" %%A IN ("%_result1%") DO set _result2=%%A
@REM remove the last character 's'
set _responseTime=%_result2:~0,-1%
But we can't stop there. If the monitoring script can't connect to the target TCP port, then it returns "?.?????" as the response time. We need to handle this situation:
@rem Parse the response time
FOR /F "tokens=2 delims=+" %%A IN ("%_result1%") DO set _result2=%%A
set _firstchar=%_result2:~0,1%
if "%_firstchar%"=="?" (
set _responseTime=0.0
) ELSE (
@REM remove the last character 's'
set _responseTime=%_result2:~0,-1%
)
It turns out to be much simpler to do the parsing in the FMS. Implementing this metric as a derived metric in the FMS would also save us time if we were to later extend this agent to work on Unix. If we reported the metric from the Unix shell script, we'd need to implement the parsing in shell (which would admittedly be simpler than doing it in Windows batch). But if it's already defined in the FMS, we could skip the parsing in the script all together.
Configure a Derived Metric
There are already some other examples of creating derived metrics in the Foglight Community, including:
Video Tutorial on Adding Derived Metrics in Foglight
How to create a Derived Metric (to count powered on VMs)
How to create a Derived Metric to count log file errors
Navigate to the Administration/Data/Create Derived Metric.
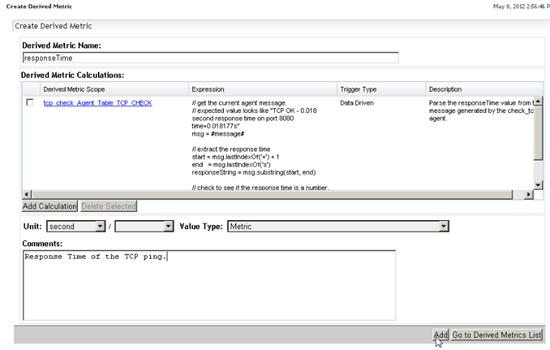
Specify the Derived Metric Name "responseTime" and click Add Calculation.
You will be prompted for the Derived Metric Scope. The scope is the object that will contain the metric you create.
In this case, specify the custom agent table beside the "message" observation.
Click the Topology Type dropdown and type "tcp". Arrow down twice to select "tcp_check_Agent_Table_TCP_CHECK".
Click the 'down' arrow to set this table as the scope.
Validate the type by clicking on the checkmark button on the top right.
You should see a message confirming that the query is valid and listing the impacted objects in your FMS.
Best Practice: Always validate the scoping expression to ensure that the metric will be created in the right place in your model.
Enter the following in the Expression field:
|
// get the current agent message // expected value looks like "TCP OK - 0.018 second response time on port 8080 time+0.018177s" msg = #message# // extract the response time start = msg.lastIndexOf('+') + 1 end = msg.lastIndexOf('s') responseString = msg.substring(start, end) // check to see if the response time is a number, or, if the connection failed "?.?????" if (responseString.isDouble()) return new Double(responseString) else return null |
Best Practice: Add comments to the expression so that it's easier to understand and maintain the calculation. For single line comments, use "//". For multi-line comments, begin with "/*" and end with "*/".
Validate the expression by clicking on the checkmark button above the Expression field.
Best Practice: Always validate the calculation after each update to ensure that no syntax errors have crept in.

Open and run the Expression Query Window to test your calculation and ensure that it works as expected with current data.
Best Practice: Always test your expression. In this case, it's much easier to use the Expression Query Window to test various input values (like "TCP CRITICAL - ?.??? second response time on port
8080 time+?.?????s") rather than reconfiguring an agent to fail.
Leave the Trigger Type at the default "Data Driven" value. We want this metric to be calculated each time new observations arrive in the FMS.
Enter a Description:
Parse the responseTime value from the message generated by the check_tcp agent.
Click Add to save the expression.
On the main Derived Metric screen, specify the Unit for the metric and add a comment.
Unit=second
Comments:
Response Time of the TCP ping.
Best Practice: Add comments to your Foglight customizations so that they are easier to understand and maintain.
Click Add to create the metric.
You will see a message telling you the there is already a derive metric called "responseTime". Click OK.'
Ready to try this on your own?
Exercise: Define an "availability" derived metric that returns 100.0 if the ping was successful or 0.0 otherwise.
Best Practice: Use a number for "availability" rather than a StringObservation like "Up" or "Down" because you can chart a number over time and get an aggregate value over any time period. Use "100.0" as the "available' value because it translates easilly into a percentage uptime.
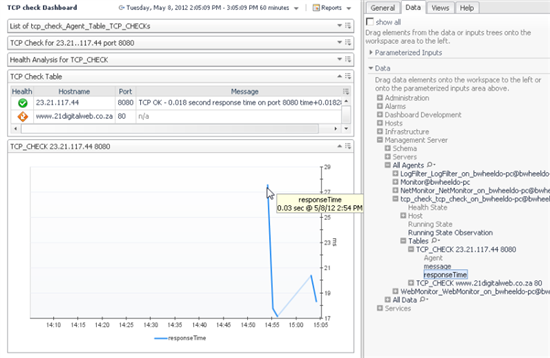
Display the metric in a Dashboard
The metric will be calculated as new agent data arrives in the FMS. Within a few minutes you could be able to pick this metric from the Data tab of a Drag and Drop dashboard or report and drop it on the page.
Next, let's configure a WCF chart to display this metric. With WCF, we have much more control of every aspect of the chart.
Create a WCF Chart
Open Configuration/Definitions as a user with "Dashboard Designer" role.
Select the target module in the top Definitions panel. We created a module called "TCPCheck" in the previous article and will continue to build on that.
With the "Views" type selected, you should see the "TCP Check Table" Row-Oriented Table in this module.
We're going to add a chart.
Click on the '+' beside Views, open Common and select Time Plot Chart. Click OK.
Like the Row-Oriented table we created last time, the Time Plot Chart editor has four tabs: General, Context, Configuration, and Flow.
General Tab
Name: TCP ping Response Time Chart
Enable Public so the chart can be used in a drag and drop portal or report.
Purpose: Pagelet, Portlet, Reportlet. Click Apply.
Context Tab
We'll configure this table to accept a list of TCP check agent tables as the Required Input.
Click the '+' in the Inputs list below the "timeRange" line.
Change the key from "(not named)" to "tcpCheckTables".
Change the List property to True.
Click in the Data Type column (where is says "Common: Object") and click the edit button. In the Select Type dialog, enter "tcp" in the search field and select the target agent table "tcp_check_Agent_Table_TCP_CHECK". Click Save.
Configuration Tab
Enable "Show Advanced Properties" to see the rich set of configuration options available for this view.
If you hold your mouse over a property name, a popup window will appear that explains the property.
Change "Always Show Customizer Icon" to false.
Open "Header". Click the edit icon beside Text and select "Localized String". In the editor, enter "TCP ping Response Time". Click Set.
Best Practice: Always specify text using a "Localized String" rather than a "String Template" or "Rich Text Template" to facilitate localization of your dashboard in a different language.
Configure the Data Binding
You will see several options for connecting the metric(s) to display to the chart.
You would use "Metric Data - Single Parent" if you wanted to display only one metric, or if all the metrics you wanted to display in the chart live in the same topology object.
We're going to allow multiple TCP Check agent tables to be shown on the same chart. That's why we configured the input context "tcpCheckTables" as a list, and that's why we're going to configure the data binding in "Metric Data - Multiple Parents". This option allows the chart to display the same metric from multiple topology objects. "Metric Data - Combined" allows you to mix and match single and multiple parent bindings.
Open Metric Data - Multiple Parents
Set "Show Data At Start and End Times" to True.
Set Metric Parents to Context. Set the Input Key to "tcpCheckTables". Click Set.
Open Metric Bindings.
Click the "+" button to add a metric binding.
Cick the edit icon beside Metrics. Select Context. Set the Input Key to "tcpCheckTables". Set the Path to target metric "responseTime - Metric". Click Set.
Click the edit button beside "Legend Labels". Select Localized String.
To display the TCP ping target host and port for each metric in the chart legend, we need to construct a parameterized string. We do that by using "{n}" elements in the string and then specifying the values that will be plugged in at runtime.
In the Edit - Legend Labels dialog, enter "{0}:{1}" in the Localized String field.
Note the prompts for "Parameter {0}" and "Parameter {1}" appear below.
Click on the Parameter {0} edit icon in the Value column and select Context.
In the Edit - Parameter {0} editor, click the dropdown beside Input Key and select "tcpCheckTables (List of tcp_check_Agent_Table_TCP_CHECKs)".
Click the dropdown beside Path and select "hostname - String". Click Set.
Click on the Parameter {1} edit icon in the Value column and select Context.
In the Edit - Parameter {1} editor, click the dropdown beside Input Key and select "tcpCheckTables (List of tcp_check_Agent_Table_TCP_CHECKs)".
Click the dropdown beside Path and select "port - String". Click Set.
Click Set in the Edit - Legend Labels dialog to complete thie data binding configuration.
Configure the default size of the chart
Click on the edit button beside "Sizing"
Change the Preferred Width from 500 to 450.
Change the Preferred Height from 500 to 200.
Click Set.
FMS 5.5.8: The preferred sizing is configured in the General tab
Allow users to maximize the chart in a popup window
Open "Popup Options"
Click the edit button beside "Allow Maximize". Check "Boolean value". Click Set.
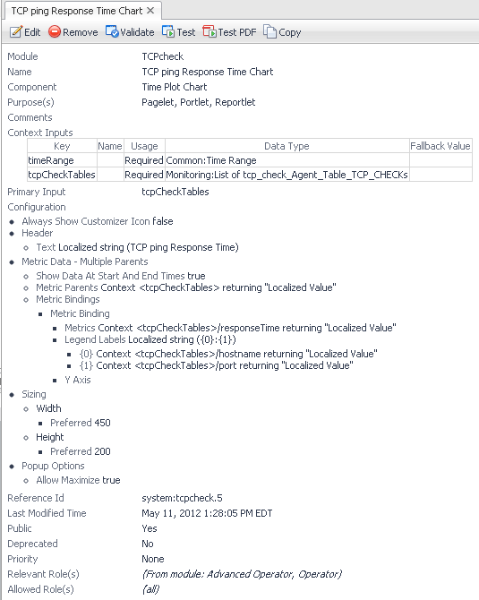
Click Save at the top to save the Chart view.
This chart configuration summary should look like this:
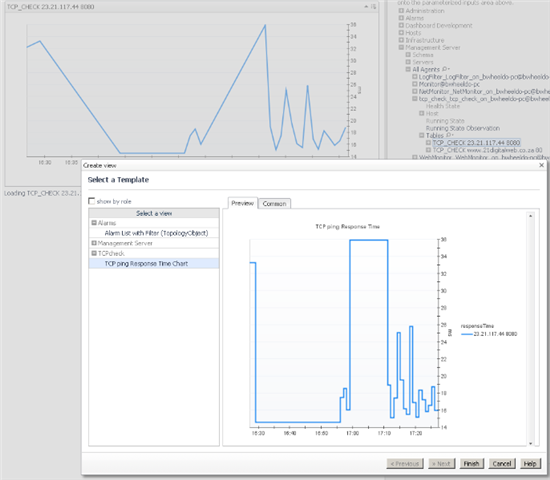
Now if you go to a drag and drop dashboard and select a TCP_CHECK table from the Data tab under Management Server/All Agents/<tcp_check_agent>/tables/ and drag it onto the page, you can "Select a view..." and choose "TCP ping Response Time Chart" from the TCPcheck module.
Note: This works with FMS 5.6.x but not 5.5.x.
Add the Chart as a Flow from the Row-Oriented Table
Next we're going to set up the Flow so that users see a popup window when they rest their mouse or click on a row of the TCP Check table. The popup view that appears will depend on which column they interact with. If they dwell or click in the Health column, an alarm list will appear. If they dwell or click in another column, the response time chart will appear.
Select the "TCP Check Table" from the Views list in the TCPcheck module.
Click Edit
Select the Flow tab.
Click on "Cell Dwell".
Uncheck "Leave unspecified".
We want to define the flow according to which row and which column they rested their mouse on, so we need to define Context Mappings for these runtime values.
In the Selected Row field, enter "tcpCheckTable"
In the Selected Column Id field, entter "selectedColumnID"
Now we define the Flow Type so that the action depends on which column the user selects.
Click the drowdown beside Flow Type and select "Choose value".
In the Context key field, select "selectedColumnID (String)". This means that the action that occurs depends on the ID of the column they click on.
Click Save (for the Edit - Cell Dwell dialog).
A "(Default)" options now appears below the Cell Dwell. We want to configure this option to pop up the response time chart we just created.
Click on "(Default)".
Select Flow Type: Popup
Next we need to transform the current row context "tcpCheckTable (tcp_check_Agent_Table_TCP_CHECK)" to the required context for the chart "tcpCheckTables" which is a list of tcp_check_Agent_Table_TCP_CHECK.
Click the "+" button in the Context table.
Replace "(not named)" with "tcpCheckTables" (to match the context name required by the chart).
Click the edit icon in the Value column and select Set to Binding > List
In the Edit Context Entry "tcpCheckTables" dialog, click the "+" below parameters, then the edit icon in the Parameter row below Value and select Context.
In the Context dialog Input Key Field, select "tcpCheckTable (tcp_check_Agent_Table_TCP_CHECK)". Click Set.
Click Set in the In the Edit Context Entry "tcpCheckTables" dialog.
Did you see what we did there? We transformed a single type into a list type by building a list and adding the table as the first item of the list.
Now in the "(Default)" flow editor, click the View selector and select the chart "TCP ping Response Time Chart" from the "TCPcheck" module. Click Save.
Set the Type to "Transient", because this is triggered from a Dwell.
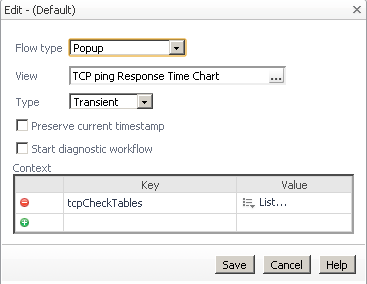
Click Save in the "Edit - (Default)" dialog.
Next we configure the Dwell action for the "health" column.
Click on the "+" button below Cell Dwell/(Default).
Click on the "Do nothing" line to edit it.
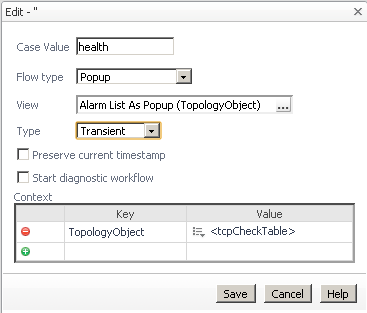
In the Edit dialog, set the Case Value to "health". This matches the "ID" value we set in the column configuration.
We want to leverage a common out-of-the-box alarm list popup, which takes a "Topology Object" as its context input. To use that dialog, we must define a matching context.
In the Context table, click the "+" button.
Replace "(not named)" with "TopologyObject".
Click the edit icon in the Value column and select Set to Binding>Context.
In the Context Entry dialog, select Input Key "tcpCheckTable (tcp_check_Agent_Table_TCP_CHECK)". Click Set.
Now that the correct Context is defined, we can select the common view.
Change the Flow type to Popup.
Click the edit icon in the View field. In the Available View dialog, open Alarms and select "Alarm List As Popup (TopologyObject)". Click Save.
Change the Type from Persistent (FMS 5.5.8=Dialog) to Transient.
Click Save.
Save the TCP Check Table view. Now test it.
Go to the TCP Check Table dashboard and rest your mouse over the table.
You should see the alarm popup on the health column and the cart will appear when your mouse rests on any other column.
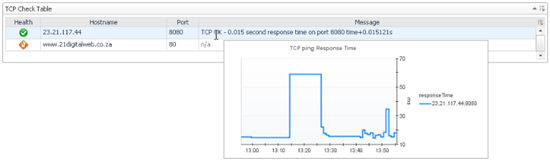
Did that work for you? If so, give yourself a pat on the back.
Now let's do one more thing: configure "persistent" popups to appear if you click on the table.
It's actually very much the same configuration as you just did for the dwell action.
Don't think of it as tedius; think of it as a way to practice your new WCF skills.
Go back to the WCF Definitions editor and edit the "TCP Check Table" again. Select the Flow tab.
Click "Cell Selection".
Uncheck "Leave unspecified".
Fortunately, the Selected Row and Selected ColumnId fields have been prepopulated with the values you configured for the dwell action above.
Click the drowdown beside Flow Type and select "Choose value".
In the Context key field, select "selectedColumnID (String)".
Click Save (for the Edit - Cell Dwell dialog).
A "(Default)" options now appears below the Cell Dwell. We want to configure this option to pop up the response time chart we just created.
Click on "(Default)" nested below "Cell Selection".
Select Flow Type: Popup
Recall that we need to transform the current row context "tcpCheckTable (tcp_check_Agent_Table_TCP_CHECK)" to the required context for the chart "tcpCheckTables" which is a list of tcp_check_Agent_Table_TCP_CHECKs.
Click the "+" button in the Context table.
Replace "(not named)" with "tcpCheckTables" to match the context input name of the chart.
Click the edit icon in the Value column and select Set to Binding > List
In the Edit Context Entry "tcpCheckTables" dialog, click the "+" below parameters, then the edit icon beside "Parameter" and below Value and select Context.
In the Context dialog Input Key Field, select "tcpCheckTable (tcp_check_Agent_Table_TCP_CHECK)". Click Set.
Click Set in the In the Edit Context Entry "tcpCheckTables" dialog.
Now in the "(Default)" flow editor, click the View selector and select the chart "TCP ping Response Time Chart" from the "TCPcheck" module. Click Save.
Click Save in the "Edit - (Default)" dialog.
Next we configure the Cell Selection action for the "health" column.
Click on the "+" button below Cell Selection/(Default).
Click on the "Do nothing" line to edit it.
In the Edit dialog, set the Case Value to "health". matching the ID specified in the Column configuration.
Recall that we want to leverage a common out-of-the-box alarm list popup, which takes a "Topology Object" as its context input. To use that dialog, we must define a matching context.
In the Context table, click the "+" button.
Replace "(not named)" with "TopologyObject".
Click the edit icon in the Value column and select Set to Binding>Context.
In the Context Entry dialog, select Input Key "tcpCheckTable (tcp_check_Agent_Table_TCP_CHECK)". Click Set.
Now that the correct Context is defined, we can select the common view.
Change the Flow type to Popup.
Click the edit icon in the View field. In the Available View dialog, open Alarms and select "Alarm List As Popup (TopologyObject)". Click Save.
Click Save.
Save the TCP Check Table view. Now test it.
Go to the TCP Check Table dashboard and click in the table.
You should see the alarm popup when you click in the health column and the chart will appear when you click on any other column.
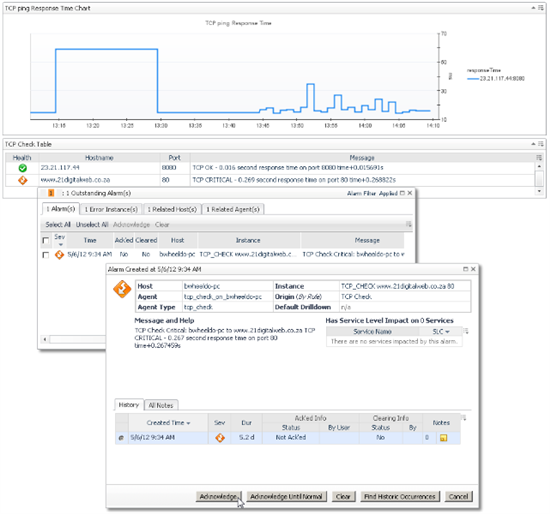
Congratulations. You've now practiced enough WCF concepts to create some great dashboards!
Ready to try this on your own?
Exercise: Add a chart to display the "availability" derived metric from the exercise described above to your dashboard.
If you'd like more guided practice building WCF dashboards before trying it on your own, you can step through Building a custom dashboard to summarize LogFilter alarms
Best Practice: Be thoughtful about the context inputs you define for your WCF views. Context is the glue that binds all the user interface components and workflows together. In this tutorial, we stepped through several examples of tranforming the context in order to connect views together.
You may have some questions about what all these WCF options mean and why you set them as you did.
The WCF reference in Foglight Help and eDocs can help you answer those questions. If you get stuck, or weren't able to follow the sequence of steps in this tutorial, please post a comment below.
A followup to this article will walk through more options for displaying this metric.
Happy Dashboarding!