• Products
    • View all products
    • Free trials
    • Buy online
    • Product lines
      • ApexSQL
      • Change Auditor
      • Enterprise Reporter
      • Foglight Database Monitoring
      • Foglight Evolve
      • KACE
      • Metalogix
      • Migration Manager
      • NetVault Backup
      • One Identity
      • QoreStor
      • Quest On Demand
      • Rapid Recovery
      • Recovery Manager
      • RemoteScan
      • SharePlex
      • Spotlight
      • Stat
      • Toad
    • Featured products
      • Cloud Management
        • Cloud Access Manager
        • Foglight for Virtualization, Enterprise Edition
        • Identity Manager
        • On Demand Migration for Email
        • Quest On Demand
        • Rapid Recovery
      • Data Protection
        • Foglight for Virtualization
        • NetVault
        • NetVault for Office 365
        • QorePortal
        • QoreStor
        • Rapid Recovery
        • vRanger
      • Database Management
        • Foglight for Databases
        • Litespeed for SQL Server
        • SharePlex
        • Spotlight SQL Server Enterprise
        • Toad Data Point
        • Toad DevOps Toolkit
        • Toad Edge
        • Toad for Oracle
        • Toad for SQL Server
      • Identity & Access Management
        • Active Roles
        • Defender
        • Identity Manager
        • Identity Manager Data Governance
        • One Identity Safeguard
        • Password Manager
        • Privileged Access Suite for Unix
        • Starling Connect
        • Starling Two-Factor Authentication
        • syslog-ng
      • Microsoft Platform Management
        • Active Administrator
        • Change Auditor
        • Enterprise Reporter
        • GPOADmin
        • InTrust
        • Metalogix
        • Migration Manager
        • On Demand Migration for Email
        • Quest On Demand
        • Recovery Manager
      • Performance Monitoring
        • Foglight Capacity Director
        • Foglight Hybrid Cloud Manager
        • Foglight for Databases
        • Foglight for Operating Systems
        • Foglight for Oracle
        • Foglight for PostgreSQL
        • Foglight for SQL Server
        • Foglight for Storage Management
        • Foglight for Virtualization
        • Spotlight on SQL Server
      • Unified Endpoint Management
        • Desktop Authority Management Suite
        • KACE Cloud Mobile Device Manager
        • KACE Desktop Authority
        • KACE Privilege Manager
        • KACE Systems Deployment Appliance
        • KACE Systems Management Appliance
        • RemoteScan
  • Solutions
    • View all Solutions
    • Industries
      • Education
      • Energy
      • Federal Government
      • Financial Services
      • Healthcare
      • State & Local Government
    • Platforms
      • Active Directory
      • Cisco
      • DB2
      • Exchange
      • Google
      • Hyper-v
      • Lotus Notes
      • OneDrive for Business
      • Office 365
      • Oracle
      • SAP/Sybase
      • SharePoint
      • SQL Server
      • Teams
      • Unix/Linux
      • VMware
      • Windows Server
    • Cloud Management
    • Data Protection
      • Overview
      • Backup & Recovery
      • Cloud Management
      • Deduplication & Compression
      • Disaster Recovery
      • Office 365 Data Protection
      • Virtualization Management
    • Database Management
      • Overview
      • Administration
      • Cloud Migration
      • Data Preparation and Provisioning
      • Development
      • DevOps
      • Performance Monitoring
      • Replication
      • Supported Platforms
        • IBM DB2
        • MySQL
        • Oracle
        • PostgreSQL
        • SAP Solutions
        • SQL Server
    • GDPR Compliance
    • Identity & Access Management
      • Overview
      • Identity Administration
      • Identity Governance
      • Privileged Access Management
      • AD Account Lifecycle Management
      • Access Control
      • Cloud
      • Log Management
    • Microsoft Platform Management
      • Overview
      • Mergers & Acquisitions
      • Migration & Consolidation
      • Office 365 Migration & Management
      • Security & Compliance
      • Windows Backup & Recovery
      • Supported Platforms
        • Active Directory
        • Cisco
        • Exchange
        • Google
        • Groupwise
        • Lotus Notes
        • Office 365
        • OneDrive for Business
        • SharePoint
        • SQL Server
        • Teams
        • Unix/Linux
        • Windows Server
    • Performance Monitoring
      • Overview
      • Database Performance Monitoring
      • Operating System Monitoring
      • Storage Performance & Utilization Management
      • Supported Platforms
        • Active Directory
        • DB2
        • Exchange
        • Java
        • Hyper-V
        • .NET
        • Oracle
        • SAP/Sybase
        • Storage
        • SQL Server
        • VMware
    • Unified Endpoint Management
      • Overview
      • Endpoint Compliance
      • Endpoint Security
      • Endpoint Visibility
      • Industries
        • Education
        • Healthcare
      • Supported Platforms
        • Internet of things
        • Microsoft® Windows
        • MAC
        • UNIX/LinuX
  • Resources
    • Blogs
      • Data Protection
      • Database Management
      • IT industry Insights
      • IT Ninja
      • Microsoft Platform Management
      • Performance Monitoring
      • Toad World Blog
      • Unified Endpoint Management
    • Customer Stories
    • Documents
    • Events
    • Webcasts
    • Technical Documentation
    • Videos
    • Whitepapers
  • Trials
  • Services
    • Consulting Services
      • Overview
      • Microsoft Platform Services
      • Data Protection Services
      • Unified Endpoint Management
      • Performance Monitoring Services
      • Database Management Services
    • Educational Services
    • Support Services
  • Support
    • Support Home
    • By Product
      • All Products
      • AppAssure
      • Archive Manager
      • Change Auditor
      • Desktop Authority
      • DR Series
      • Foglight
      • KACE
      • Migration Manager
      • NetVault
      • Rapid Recovery
      • SharePlex
      • Toad
      • vRanger
    • Contact Support
      • Overview
      • Customer Service
      • Licensing Assistance
      • Renewal Assistance
      • Technical Support
    • Download Software
    • Knowledge Base
    • My Account
      • My Products
      • My Service Requests
      • My Licenses
      • My Groups
      • My Profile
    • Policies & Procedures
    • Consulting Services
      • Microsoft Platform Management
      • Data Protection
      • Unified Endpoint Management
      • Performance Monitoring
      • Database Management
    • Technical Documentation
    • Educational Services
    • User Forums
    • Video Tutorials
  • Partners
    • Overview
    • Partner Circle Log In
    • Become a Partner
    • Find a Partner
    • Partner Community
  • Blogs
    • IT Industry Insights
    • Quest Solution Blogs
      • Data Protection
      • Database Management
      • ITNinja
      • Microsoft Platform Management
      • Performance Monitoring
      • Toad World Blog
      • Unified Endpoint Management
  • Forums
  • 製品情報
    • すべての製品情報を見る
    • Change Auditor
    • Foglight
    • KACE
    • Metalogix
    • Migration Manager
    • Migrator for Notes to SharePoint
    • NetVault Backup
    • On Demand Migration for Email
    • QoreStor
    • Rapid Recovery
    • Recovery Manager
    • SharePlex
    • Spotlight
    • Toad
  • ソリューション
    • すべてのプラットフォームを見る
    • クラウド管理
    • GDPRコンプライアンス
    • データ保護
      • 概要
      • クラウド管理
      • ディザスタリカバリ
      • バックアップとリカバリ
      • Office 365 データ保護
      • 仮想化管理
      • 重複除外と複製
    • データベース管理
      • 概要
      • DevOps
      • データの準備と分析
      • データベースのクラウド移行
      • データベースパフォーマンス監視
      • データベース管理
      • データベース複製ソフトウェアツール
    • 統合エンドポイント管理
      • 概要
      • エンドポイントコンプライアンス
      • エンドポイントセキュリティ
      • エンドポイントの可視化
    • Microsoftプラットフォーム管理
      • 概要
      • ハイブリッドActive Directoryのセキュリティとガバナンス
      • Microsoftプラットフォームの移行計画と統合
      • セキュリティとコンプライアンス
      • 情報アーカイブおよびストレージ管理ソリューション
      • Windowsのバックアップとリカバリ
      • Microsoft Serverのパフォーマンスと可用性
      • レポート作成機能
      • グループポリシーと権限
    • パフォーマンス監視
  • サービス
    • コンサルティングサービス
      • 概要
      • Microsoftプラットフォーム管理
      • データ保護
      • 統合エンドポイント管理
      • パフォーマンス監視
      • データベース管理
    • トレーニングと認定資格
    • サポートサービス
  • サポート
    • サポートホーム
    • 製品で検索
      • All Products
      • AppAssure
      • Archive Manager
      • Change Auditor
      • Desktop Authority
      • DR Series
      • Foglight
      • KACE
      • Migration Manager
      • NetVault
      • Rapid Recovery
      • SharePlex
      • Toad
      • vRanger
    • お問い合わせ
      • すべて
      • カスタマサービス
      • ライセンス アシスタンス
      • 更新のアシスタンス
      • 技術サポート
    • コミュニティフォーラム
    • ソフトウェアのダウンロード
    • ナレッジベ%E3%83%BCス
    • マイアカウント
      • マイ プロダクト
      • Myサービスリクエスト
      • マイ ライセンス
      • マイ グループ
      • マイ プロファイル
    • ポリシーおよび手順
    • コンサルティングサービス
      • Microsoftプラットフォーム管理
      • データ保護
      • 統合エンドポイント管理
      • パフォーマンス監視
      • データベース管理
    • リリースノートおよびガイド
    • 教育サービス
    • ビデオチュートリアル
  • トライアル
  • パートナー
    • 概要
    • Partner Circleへのログイン
    • パートナーになる
    • Find a Partner
    • パートナーコミュニティ
  • コミュニティ
Quest Community
Quest Community
  • Site
  • User
  • Site
  • Search
  • User
Foglight
Foglight
Foglight Administrators Understanding Foglight Metrics
  • Forum
  • Wikis
  • Sub-Groups
  • More
  • Cancel
  • New
  • -Foglight Administrators
    • A New Foglight Service Status Widget - Text with Colored Background
    • Adding APM views to an existing Foglight Java cartridge installation
    • Adventures in Agent Creation - Part 1
    • Adventures in Agent Creation - Part 2
    • Adventures in Agent Creation - Part 3
    • Anonymizing the Foglight End User Monitoring Solution
    • Another Foglight Service Status Widget - Colored Text
    • Building a custom dashboard to summarize LogFilter alarms
    • Building a geo drag and drop Foglight dashboard for a service
    • Building Complex Schedules with Foglight
    • Busting Frame Busters in Foglight Experience Viewer (FxV)
    • Community Cartridge: Notification Management Cartridge
    • Compatibility for Navigation Timing API
    • Configuring Internet Explorer 9 (IE9), to best work with Foglight
    • Converting Foglight 4 Script Agents to Foglight 5
    • Creating Load Testing Scripts from FxM and FxV Session Data
    • Custom Agents - Introduction to Script Agents
    • Custom Agents - Script Agent Data Modeling and Units
    • Custom Foglight Dashboards: adding alarm colors to spinners, jelly beans and other gauges
    • Custom Script Agent 1: Leverage an Existing Monitoring Script To Push Data into Foglight
    • Custom Script Agent 2: Build a WCF Dashboard to View the Custom Agent Data
    • Custom Script Agent 3: Add a Metric and Build a WCF Chart to Display it
    • Custom Script Agent 4: Add a Metric to a Table
    • Customizing Foglight – Expert Services Discount Available for a Limited Time!
    • Customizing the out-of-the-box Host Status view
    • Dashboard speed-up
    • Deploying Two FglAMs to the Same Windows Host and running each as a Windows Service
    • Different Thresholds for Different Tablespaces
    • Different Thresholds for Different Tablespaces - Part 2
    • Emailing reports with the proper name and format
    • FGL IDE (Export Customizations & more)
    • Flexible, Cost-effective Remote Administration Services
    • Foglight 5 - Topology Localization
    • Foglight Advanced Administration Training - Limited Space for February 2012
    • Foglight APM Basics (Videos)
    • Foglight APM Features (videos)
    • +Foglight Best Practices
    • Foglight Best Practices (videos)
    • Foglight Best Practices Monthly Webcast – Sign Up for Session 1!
    • Foglight Best Practices: Dashboards and Reports Webcast Registration Open Now!
    • Foglight dashboard as a SharePoint WebPart
    • Foglight Dev Camp & Hackathon 2017
    • Foglight End User Management: Using Network TAPs versus a Switch SPAN Port
    • Foglight End User Service Availability Reporting, Foglight Experience Monitor or Foglight Transaction Recorder which one to use?
    • Foglight Event Synchronization Solution for HP Operations Manager Services Pack Available Now!
    • Foglight Experience Viewer (FxV) URL Search Shortcuts
    • Foglight Host OS Monitoring (videos)
    • Foglight iGoogle Gadget
    • Foglight nologinuser dashboard in SharePoint
    • Foglight Public Virtual Training Courses
    • Foglight Quickstart Services Offering
    • Foglight Reporting using Metric Queries or Groovy
    • Foglight Training Classes -- Public and Private Options Available
    • Foglight Training Packages with Free Healthcheck Services - Limited Time Offer
    • Fraud Support with FxV
    • FxM and Apache Proxy Server (X-Forwarded-Host)
    • FxM: IP Multicasting and Sessionizing
    • FxV Storage Tier Expansion & Analysis Repository Considerations
    • Getting the most out of Foglight's .NET Monitoring - Part 1
    • Getting the most out of Foglight's .NET Monitoring - Part 2: Agent Configuration Specifics and Best Practices
    • Getting the most out of Foglight's .NET Monitoring - Part 3: Monitoring a .NET Executable Application
    • HDIDT - View an Exported Real User Session File
    • How are your Java components processing?
    • How to Handle NTLM within UEM
    • Improve Organizational Adoption of Your APM Solution
    • January Foglight Best Practices Thursday, January 5 - Register Now!
    • Java APM
    • June 2012 Best Practices Webcast Open for Registration!
    • Migrating your Foglight Management Server
    • Monitoring .NET Request Memory Usage with Foglight
    • Monitoring an independent Java process using Foglight
    • Monitoring application availability using Foglight Utility Agents
    • New Foglight Services Packs Available
    • New Sizing Guide for FxM and FxV
    • New UEM Sizing Guide
    • Predicting the Impact of Moving a Guest to Another Host
    • +Quest Application Performance Monitoring (APM) Implementation Methodology
    • Reading a XML File with a powershell script agent
    • Really Simple (Foglight) Syndication
    • Services Section of Quest.com Gets a Facelift
    • Setting the value of a Registry Variable from the Command Line
    • SNMP trap variables in Foglight Alarms
    • The End-User as an Instrument...
    • Thoughts from the road - Foglight Java agent Tag and Follow
    • Thoughts from the road – User session replay - YOU CAN ACTUALLY DO THAT???
    • Training Update - New Foglight Reporting Course Available
    • Understanding Foglight Metrics
    • Updates to Quest's Foglight Public Virtual Training Calendar
    • Use a Foglight to monitor itself
    • Use Foglight to Drive Business Performance
    • Use Foglight to monitor itself
    • User Experience Mgmt Overview
    • Using telnet or wget to check connectivity
    • Using the ConfigService API to setup agent properties (ASPs)
    • Utilizing MS Exchange distribution lists to help with user attribute maintenance
    • We've Redesigned SupportLink to Get You Answers Faster Than Ever - See for Yourself and Enter to Win an iPad!
    • [Case Scenario] - How to avoid duplicate rows when building a report with 5 min granular data
  • (iNdOrE) && (GwAlIoR) +91-9915786526 ##LoVe Marriage Specialist Pandit ji kota
  • Custom Script Agent - Counting Files in a Windows Folder - How-To
  • Foglight Admin 101
  • Foglight monitoring application components running on Docker Containers
  • Foglight User 101
  • Memory Utilization for all processes over X months
  • NetMonitor - Quick How-To Guide
  • Setting JBoss Server name and domain in Foglight
  • Setting Tomcat server name and domain in Foglight
  • testing a bug - Do not publish
  • WebMonitor - Quick How-To Guide
  • WebMonitor agent installation

Understanding Foglight Metrics

In this article, Quest Principal Architect Brian Wheeldon discusses Foglight metrics: What they are, what elements they contain, how they're managed, what they mean and how they can be visualized.

Metric Definition

A metric is a particular type of observation representing a numeric value over time.

A metric may originate as a series of observations collected by an agent (raw metric), or it may be calculated in the FMS (Foglight Management Server) based on other observations (derived metric).

The most basic way to examine a metric in Foglight is to open the Data browser under "Configuration" and open one of the branches of the data tree until you find and select a metric.

This is what it looks like:

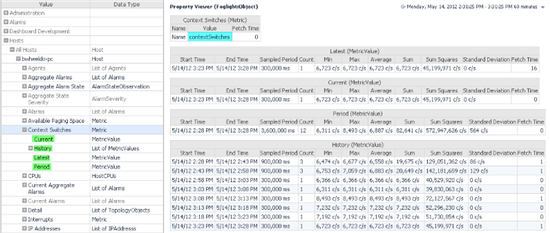
In this screenshot, the Host/Context Switches metric is selected in the left panel and displayed on the right right side of the page.

This metric has four sub-elements: Current, Latest, Period, and History

Each of these sub-elements is a MetricValue or a list of MetricValues.

Current

When a metric observation arrives in the FMS, it looks like the Current value in this screenshot.

The current property is the most recent entry that applies to the current time range, as long as it hasn't gone stale. The most recent value is the one with the greatest endTime that is equal to or before the end of the selected time range, and could be before the start of the selected time range.

If an agent is deactivated, then new metrics from that agent will stop arriving in the FMS. When that happens, the "Current" value will go stale and disappear when the last observation is less recent than the end of the selected time range minus three times the sample period.

Latest

The Latest property will continue to show the most recently collected timestamp and value for the metric. If you stopped data collection of an agent yesterday and looked at a metric collected by that agent today, Current would be null (n/a, or not available) and Latest would show the last observation yesterday before data collection stopped.

Even if you're looking at a historic time range. the latest property will still contain the most recent value available.

Period

The Period MetricValue is an aggregate of all observations collected in the selected time range. In the one hour period shown in the screenshot, 12 observations (five minutes apart) are combined with Min, Max, Average and Sum values aggregated across those observations.

History

The metric's History is a list of MetricValues collected in the selected time range. A value will appear in the history if its endTime is after the start of the selected time range, and equal to or before the end of the selected time range.

Automatic Aggregation

A metric actively collected every five minutes will have a "Current" End Time within the last five minutes and a Start Time five minutes before that. The Sampled Period will be 300,000 milliseconds, or five minutes.

The Count will be "1" because there is one observation in that five minute time range and Min, Max, Average and Sum will all be equal because there is only one observation. Sum Squares will be the square of the single observation value and Standard Deviation will be zero.

As the observations age, they will be rolled up according to the configured persistence policies defined in the FMS. You can see the rollups begin to take effect in the oldest MetricValues under History in the screenshot above.

These two MetricValues show a Sampled Period of 900,000 milliseconds or 15 minutes. The Count is "3" because three raw observations were rolled up into this time range. The Min, Max, and Average are slightly different. The Sum and Sum Squares reflect the aggregation of these three different values. The Standard Deviation is non-zero.

As the observations age further, the 15 minute aggregations will be combined into hourly and then 4-hour MetricValues until they are ultimately purged (or not) according to the persistence policies.

Aspects of a Metric Observation

Each MetricValue has a set of properties that you can see on the right of the screenshot above.

Start Time: the starting time of the observation

End Time: the end time of the observation

Sampled Period: the number of milliseconds representing the collection frequency of the metric. This will usually match End Time - Start Time.

Count: the number of raw observations rolled up into the MetricValue

Min: the minimum value of the metric in the time range

Max: the maximum value of the metric in the time range

Average: the average value in the time range

Sum: the total of all observations in the time range

Sum Squares: the total of all observations in the time range squared

Standard Deviation: the statistical variance of the observation in the time range

The Sampled Period, Count and Sum Squares are used for calculating roll ups and are not typically interesting to display.

The other values are useful to display. If you drag and drop a metric on a custom dashboard, you can choose the Metric Analyzer or Metric Analyzer (detailed) views to visualize it

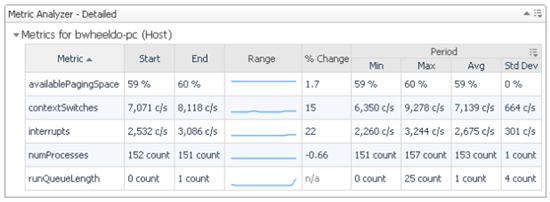
To see this view in a drag and drop dashboard or report, drop the parent of the target metrics on the page and choose "Select a view..."

Select the template Management Server/Commons/Metric Analyzer - Detailed

Best Options for Visualizing Metrics

When you think of a numeric value that varies over time, you probably imagine a chart, or more specifically, a time chart. Most of us will usually select a Time Plot Chart to display a metric on a custom dashboard for good reason: it's the clearest and most flexible display of a value over time.

To keep charts simple and easy to read while also communicating a sense of the variability of the target metric(s), a Time Plot Chart displays the "Minimum/Maximum" metric value by default. "Minimum/Maximum" compares each time slice average to the period average. If the time slice average is greater than the period average, the time slice maximum is plotted. If the time slice average is less than the period average, the time slice minimum is plotted.

You can configure a chart to show more a detailed representation of the the minimum, maximum and average in each time slice.

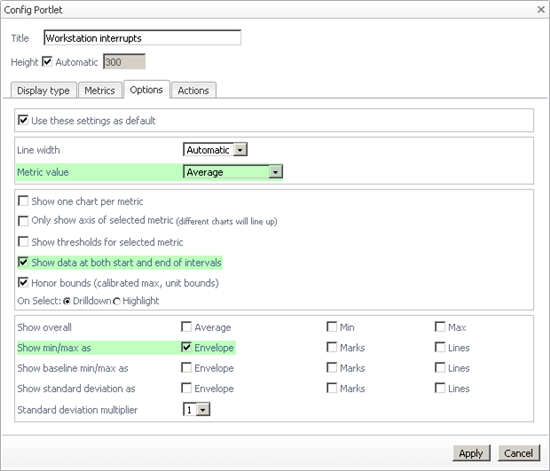
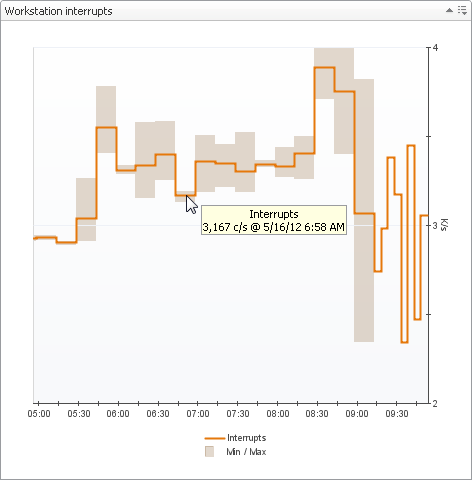
This chart is configured to display the Average metric value, indicating the value at the start and end of each time slice, with the min/max displayed as an envelope.

Notice that the time slices at the right edge show "current" observations with small time slices and min==max==average.

As automatic rollups are applied, the time slices towards the left get wider and you can see the envelope from min to max with the average value between them.

Charts are the most commonly used view for metric display, but other visualizations are also available.

Time Bar Charts emphasize the individual data samples while area charts highlight the magnitude of the value.

Stacking each of these types is useful when you want to visually sum different metrics. For example, Stacking User CPU time and System CPU time shows not only these two values, but also the total CPU usage over time.

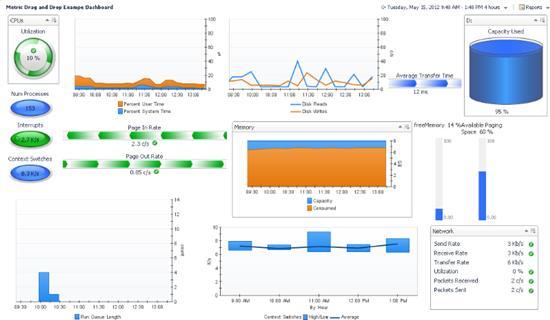
Other views display the current value of a metric. Here are some example metric views in a drag and drop dashboard.

Best options for Presenting Metrics in Tables

Beyond charts, the workhorse for displaying metrics is a table. Which aspects of a given metric to display depend on how the table will be used.

For monitoring, the current value of a metric is most important to emphasize.

For reporting, the period average is usually the most important value.

Other aspects of a metric are also worthy of inclusion in a table.

A "Sparkline" gives a sense of the variability, shape and direction of the metric. A sparkline is a "data-intense, design-simple, word-sized graphic" invented by data visualization pioneer Edward Tufte. This renderer provides a tremendous amount of information about the metric value history within a small number of pixels.


Supporting the average value with the Max or Max and Min provides context for understanding the range of the value.

Sum is useful for metrics like error count - how many errors occurred in the last 4 hours, last day, last week? How much time does the app spend processing logins compared to other requests

There are some good examples of all these displayed in the Java Requests dashboard.

Can you spot which aspects of the the RequestType metric are displayed in this table?

Completed=Period/Sum, Incomplete=Period/Sum, Current=sparkline+Current/Average, Avg=Period/Avg, Total=Period/Sum, Exception Exits=Period/Sum, Traces=Period/Summ

Good understanding of metrics will help you understand your monitored environment better.

Thoughtful selection of the visualization and aspects of the metrics to display will help you build better, more informative dashboards and reports.

  • charts
  • performance metrics
  • metrics
  • custom dashboard
  • tables
  • time range
  • edward tufte
  • Foglight Administration views
  • wcf
  • sparkline
  • Share
  • History
  • More
  • Cancel
Related
Recommended
  • Company
    • About Us
    • Buy
    • Contact Us
    • Careers
    • News
  • Resources
    • Industry Insights Blog
    • Communities
    • Customer Stories
    • Documents
    • Events
  • Support
    • Professional Services
    • Renew Support
    • Technical Support
    • Training & Certification
    • Support Services
  • Social Networks
    • Facebook
    • LinkedIn
    • Twitter
    • YouTube
  • © 2023 Quest Software Inc. ALL RIGHTS RESERVED.
  • Legal
  • Terms of Use
  • Privacy
  • Community Feedback & Support
  • Cookie Preference Center
  • 会社名
    • 会社情報
    • 購入
    • お問い合わせ
    • 採用情報
    • ニュース
  • リソース
    • ブログ
    • お客様の事例
    • ドキュメント
    • イベント
    • ビデオ
  • サポート
    • プロフェッショナルサービス
    • サポートの更新
    • テクニカルサポート
    • トレーニングと認定資格
    • サポートサービス
  • ソーシャルネットワーク
    • Facebook
    • Instagram
    • LinkedIn
    • Twitter
    • YouTube
  • © 2023 Quest Software Inc. ALL RIGHTS RESERVED.
  • 「法務」
  • ご利用規約
  • 個人情報保護方針
  • コミュニティのフィードバックとサポート