Hi all,
In Part 1 of this article I covered some conceptual basics concerning .NET application monitoring. In Part 2 I explained some details concerning Foglight's .NET agent configuration and best practices for ensuring the agent is configured the way you want it to be. Here in Part 3 we'll apply this information to the specifics of setting up the agent to monitor a .NET Executable Application.
Once again I'd like to thank my colleague Keith O'Leary for providing excellent content for this article.
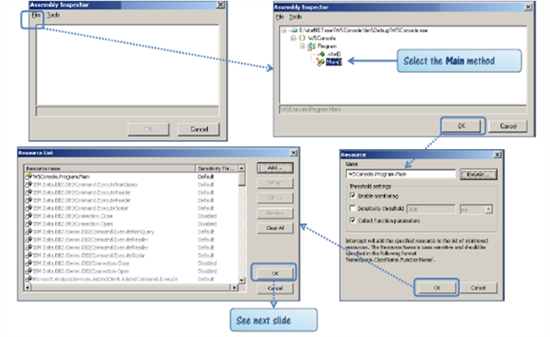
In what follows, you may need some implementation details concerning the application you want to monitor. Knowledge of the application's .NET assembly structure may be required in order to isolate the application's Main() method. Foglight's .NET agent has an assembly inspector that will help you.
By default, Foglight's .NET agent does not define any entry points for console applications as it does for ASP.NET applications. In general, if a .NET executable's Main() method is defined as an entry point no data will be captured by the agent, since the application will never leave the main method until it terminates. By initially defining all namespaces for a console application as entry points and then configuring the Main() method as a resource, the agent will be able to capture and report data. Note that defining a method as a resource will disable it from acting as an entry point.
Step 1: FMS UI
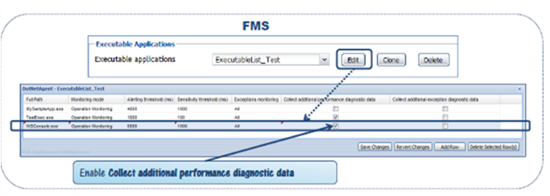
Before configuring the application on the intercept console, the application needs to be added to our list of Executable applications on the FMS, in the .NET agent properties UI. Initially you should enable Collect additional performance diagnostic data - this will enable all namespaces for monitoring - later on as you see collected traces, you could disable this option and only configure specific namespaces.
This information will get transmitted to the .NET agent's intercept studio applet on the monitored host.
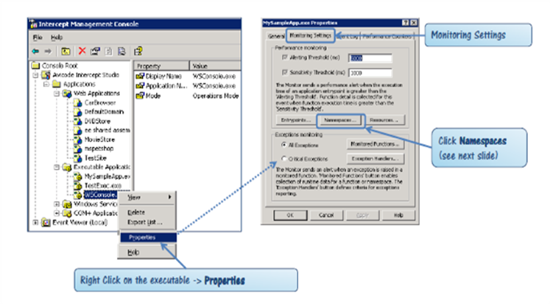
Step 2: Using the Intercept Studio on the Monitored Host, configure All Namespaces as Entry Points. Find the entry under Executable Applications for your application and edit its properties. Under Monitoring Settings, click Namespaces.
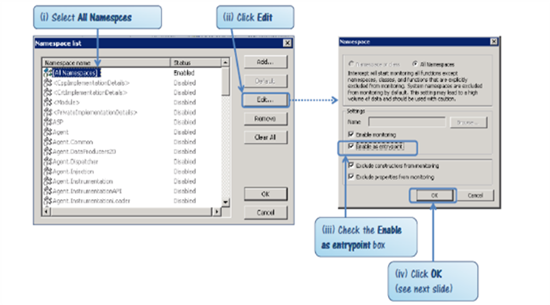
Make sure All Namespaces is enabled and that both Enable Monitoring and Enable as Entry Point are checked:
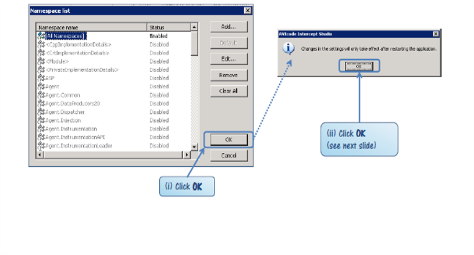
Click ok and then ok again but don't restart the app yet:
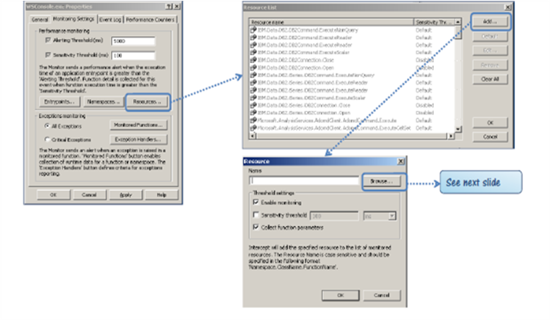
Step 3: Using the intercept studio, configure the application's Main() method as a Resource. By defining a function as a resource the agent will instrument that particular function and show it in the call tree for an Entry Point's traces if that function was called in the trace. In the Resource List You can see all the default Resources which are enabled (Default) or Disabled. Click Add to Add a Resource, then Browse - this will bring up the Assembly Inspector. The Assembly Inspector will let you review the methods contained in a .NET Assembly. You can open the application's .exe - this should allow you to find the Main() method, as shown in the following three images:
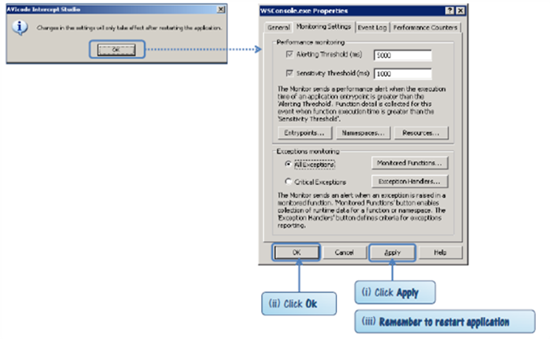
That should do it. Remember to re-start the .NET Application after you've made these changes, and have fun with Foglight. ![]()
Robert Statsinger


