Hi, this is Darren Mallette, a Solutions Architect with Quest Software. In our last entry, we looked at a couple common VMWare Infrastructure alarms and Thomas Bryant III provided direction for the VMWare Administrator to respond to those. We are now going to look at modeling the resource consumption of a guest and predict its impact prior to moving it to another host.
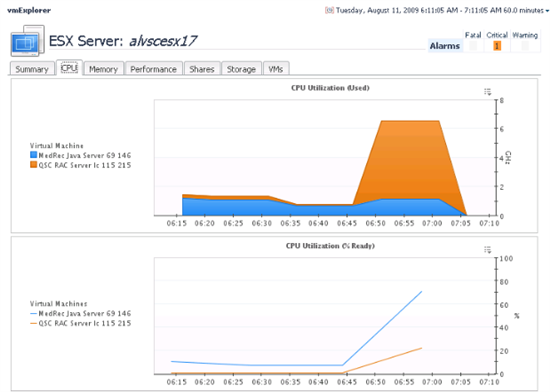
It is a fairly common occurrence that one guest on a host has a workload significantly different from the others, so much so that it impacts the performance of the other guests on a host. We can use our Foglight dashboards and alarms to identify these problem guests. We can see below that the “QSC RAC” guest is using a lot of cpu, while the cpu ready % of the “MedRec Java” server is creeping higher. We should consider moving the “QSC RAC” guest, but where to?
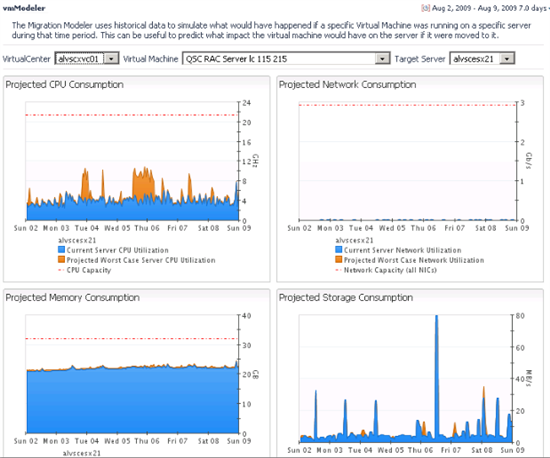
The vmModeler dashboard in Foglight helps to answer that question. We can pick our offending guest (“QSC RAC”) and a target host (alvscesx21 in this case). The 4 graphs will show several interesting metrics. First of all, the red line is the upper capacity for the target guest. The blue band of each graph is the historical utilization for that metric on the target host, for the time range selected in the top right. I italicized that last piece because it’s important. For this type of analysis, we don’t want to just look at the default time range – the last 4 hours. We want to extend historically to get a better picture of the resources being utilized.
The most important part of the graphs is the orange band. This is the utilization for our problem guest (“QSC RAC”). We don’t want the orange band going above, or really, even near the red lines. Based on the analysis below, we can conclude that it would be a safe move for “QSC RAC” to go to alvscesx21.


