
Once Foglight for Databases or Foglight for SQL Server has been installed, you’ll need to tell it what to monitor. Since Foglight doesn’t use any agents installed on the monitored systems, all you have to do is provide Foglight a SQL and Windows account with the permissions necessary to remotely connect to your systems and gather performance metrics. Let’s step through the process.
By the way, if you get any errors during this process, just restart the Foglight service and retry.
Registering a connection to a single server
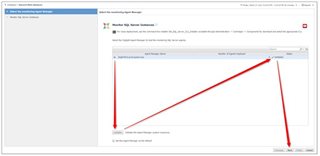
Click the Monitor button and you’ll get a menu offering a list of the different types of systems you can connect to. This post will use SQL Server as an example. Selecting it from the list brings up a connection dialog.
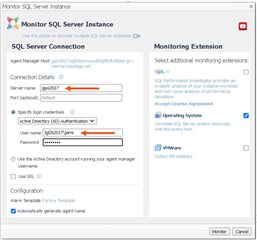
The left side of the connection dialogue is where you specify the SQL Server you would like to monitor and then give Foglight the credentials it will need to connect and gather metrics from it.
The easiest approach is to use a single domain admin account that has SQL and Windows Administrative permissions on the instances and hosts that you’d like to monitor. But if you would like to use lesser-than-administrative permissions you can see what's needed here: https://support.quest.com/technical-documents/foglight-for-sql-server/5.7.5.35/deployment-guide/4#TOPIC-654578
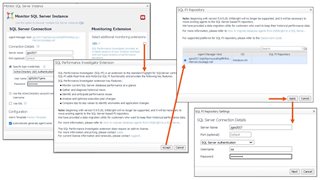
Clicking SQL PI sets up Performance Investigator, the analytics portion of Foglight for Databases – you’re going to want it. First, you’ll see a license agreement that states that the PI functionality requires and add-on license. Click Accept to continue. Next, you’ll be asked where the PI components should reside, and you’ll be presented with a list of “Agent Manager Hosts” to choose from. Larger Foglight installations (e.g. monitoring more than several hundred connections) will have multiple Agent Managers to distribute Foglight’s collection processes over multiple machines, but chances are you’ll only have one here, so just hit Apply.
Next, you’ll see that SQL PI wants to create a SQL Server database for the SQL PI repository (that Foglight fully manages). You will need to add the Server name, port and administrative credentials that will be used for the SQL Server repository.
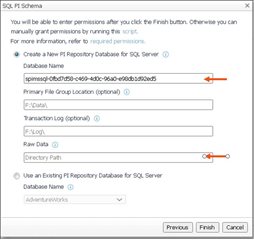
After Foglight successfully connects to the SQL Server database, you will be prompted for the name and location of the repository database. You can change the default name if you don't want the GUID attached. For example, the database name can be named Foglight-SQLPI. The File Group and Transaction Log locations default to the current location of your data and logs files which you can change if you need to. The Raw Data directory is used during the insert of performance data into the SQL Server repository. If there is latency during the inserts, Foglight will temporarily store the data in this directory.
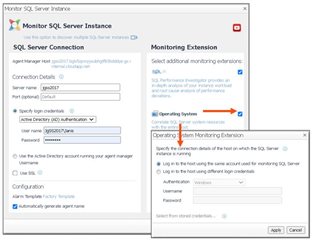
We’ll want Foglight to monitor our SQL Servers’ host systems, so make sure the Operating System box is checked and then click on the text below it (“Correlate SQL Server…”). This provides a place where you can give Foglight some credentials to collect performance metrics from Windows. If the account that you earlier gave Foglight to monitor SQL Server also happens to be a Windows Administrator on the machine we’re monitoring, you can go with the default option here, or you can of course supply an alternate account.
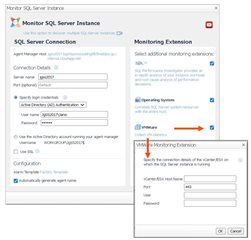
If the SQL Server that we will be monitoring is running on an operating system hosted on VMware, Foglight can provide some high-level VMware metrics that might enable you to trace a database problem back to an issue of resource allocation in your virtual environment. A user, read-only login is sufficient here.
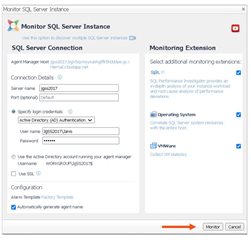
At this point you’re done, and you can click Monitor. If any errors are returned, some common issues to check are whether you've mistyped a password for an account you're using or left out the SQL Server port you're using if it's not the default. If you continue to get errors but can't figure out why, just restart the Foglight service and retry. And if that doesn't work let us know and we'll take a look at it.
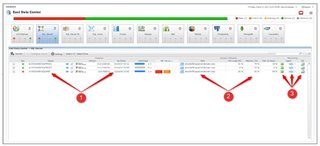
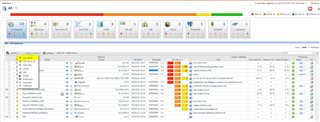
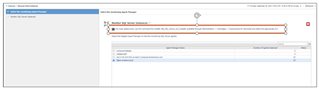
Now you should see a row in the global Databases page with (1) the name of the instance and the time monitoring of it started, (2) the name of the host along with its basic infrastructure metrics and (3) indicators that Foglight’s various collector components are running.
Registering multiple server connections at once

If you’ve got a lot of database servers that you’d like to monitor with Foglight, you don’t have to register them one at a time as above - the connection dialogue has an option that lets you efficiently set up monitoring of many systems at once: 'Use this option to discover multiple SQL Server instances'
You’ll be asked to specify the Agent Manager that will be responsible for collecting metrics from the systems we will now be registering. Remember that larger Foglight installations (e.g. monitoring more than several hundred connections) will have multiple Agent Managers, but chances are you’ll only have one here, so click Validate and that should enable the Next button for you to click.
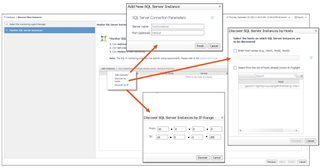
There are three options for creating the list of systems to register with Foglight. (1) you can add specific SQL Server instances one at a time, (2) you can point to a host and have Foglight discover SQL Server instances on it, (3) you can tell Foglight to scan for SQL Server instances within a specified IP range.
Additionally, you can do a mass deployment by using the command line installer, DB_SQL_Server_CLI_Installer, available through Administration -> Cartridges -> Components for download. There is a readme document (in the download) that has instructions on how to create a file that has the registration specs for systems you'd like to set up.
Next Steps
Now that you've got some connections set up, you might want an introduction to getting around the data you're collecting. Here's a good place to start:
https://www.quest.com/community/b/en/posts/three-routes-through-an-ocean-of-performance-metrics
Other Quest Database Performance blog posts can be found here.
