
A Picture is worth a thousand words!
Execution plans can help us identify the performance hog sections of SQL code that impact CPU usage and I/O operations. Addressing these bottlenecks can ultimately help us achieve the best execution times. What if an execution plan could go even beyond what we have in SQL Server Management Studio (SSMS). For example, what if we could see a plan based on environment specific metrics, such as CPU usage only, I/O operations only, or both. What if the execution plan could hide and group less costly nodes so we have a much better overall picture. Even more exciting, what if we could review an execution plan that not only displays node costs by but also cumulatively displays the direct path of the mostly costly nodes.
Spotlight 12 Plan Visualization feature can do all that and more! The following screen shots present Spotlight Plan Visualization features and some comparisons to SSMS estimated execution plans:
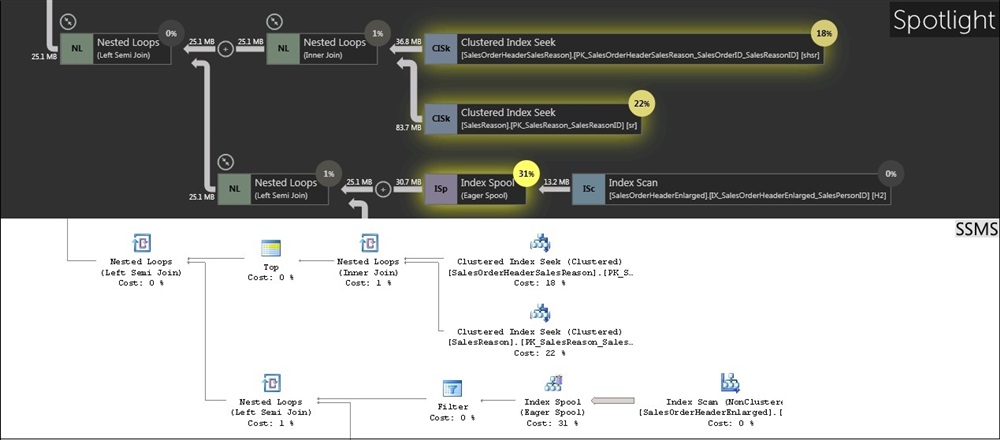
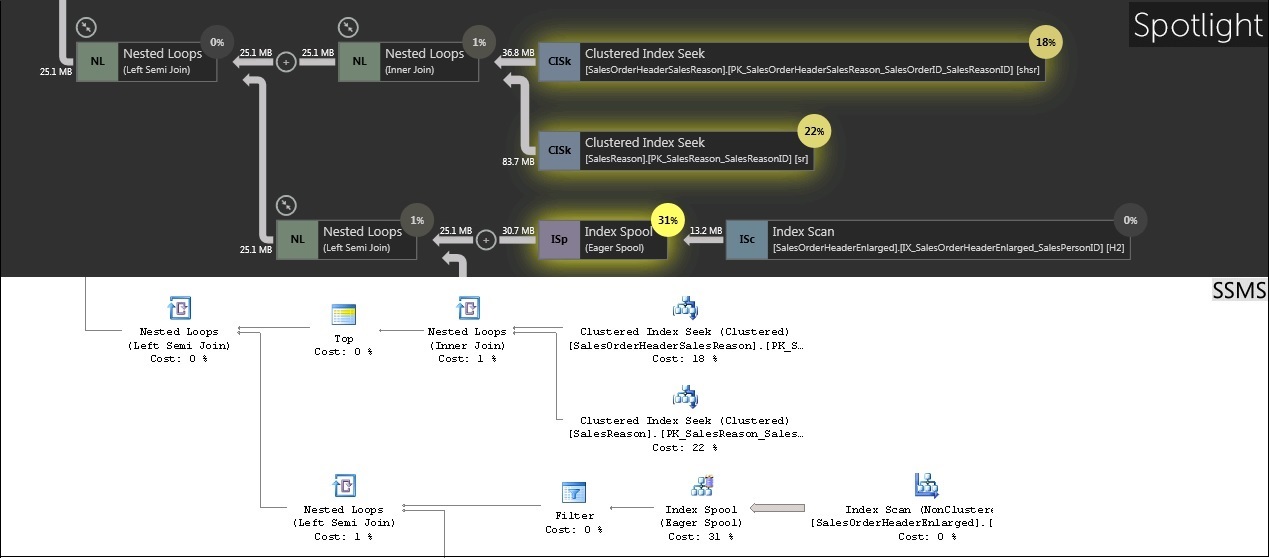
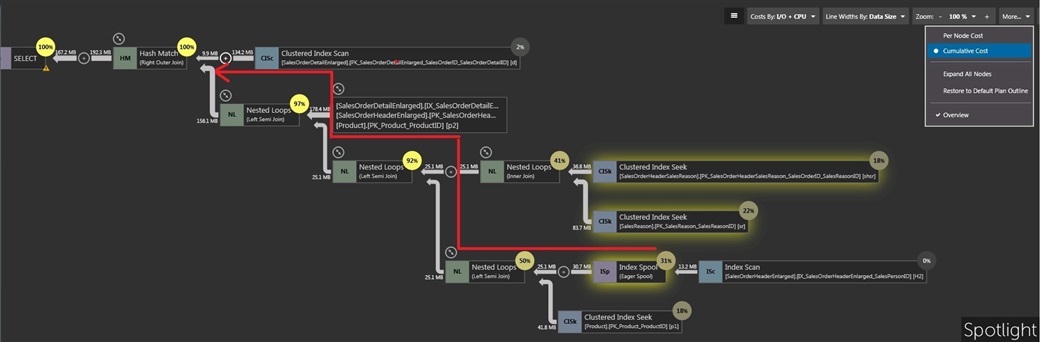
- Hide low-cost nodes:

- Highlighted high-cost operations, intensified color as cost values rise and glow effect on top nodes:
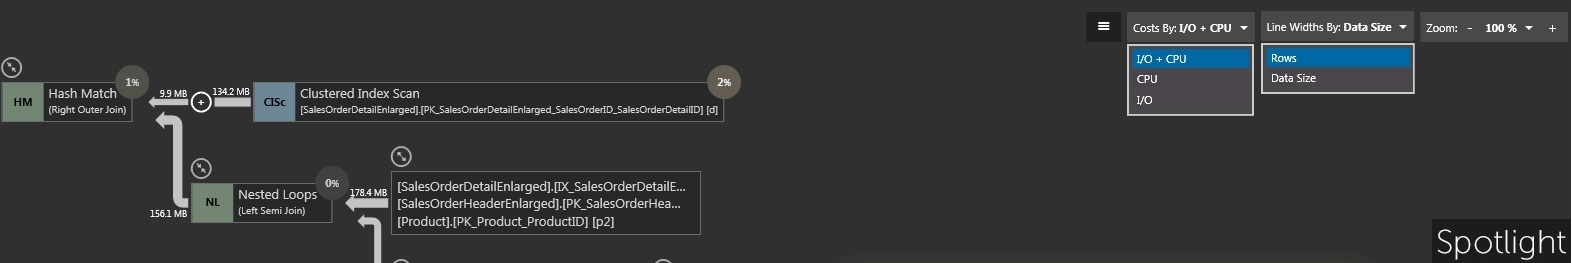
- Plans based on CPU only, I/O only or CPU + I/O costs. Branch line widths based on number of rows or data size:

- Plans based on costs per node or cumulative:

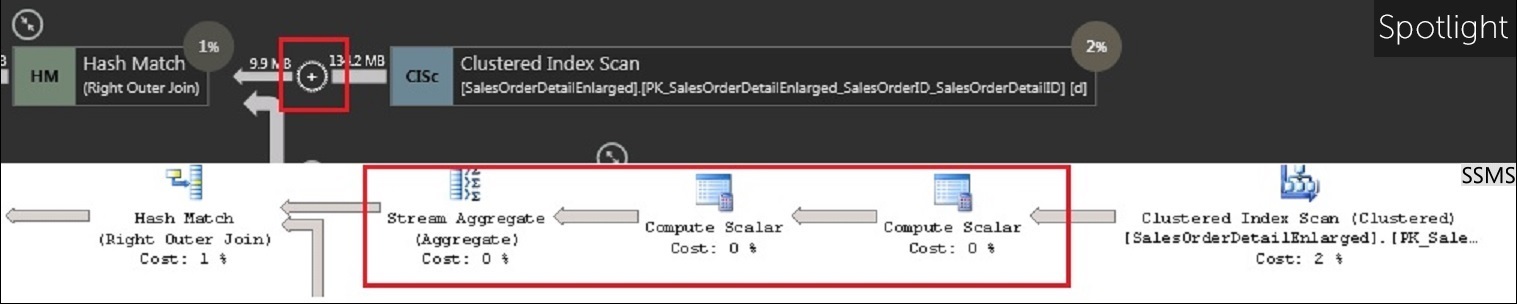
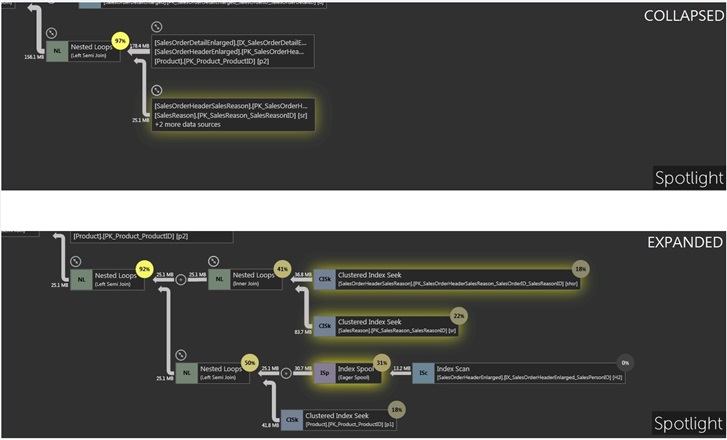
- Expansion and grouping of branches and nodes. Object names displayed when grouped:

- Tooltips available for operator, lines and grouped branches:
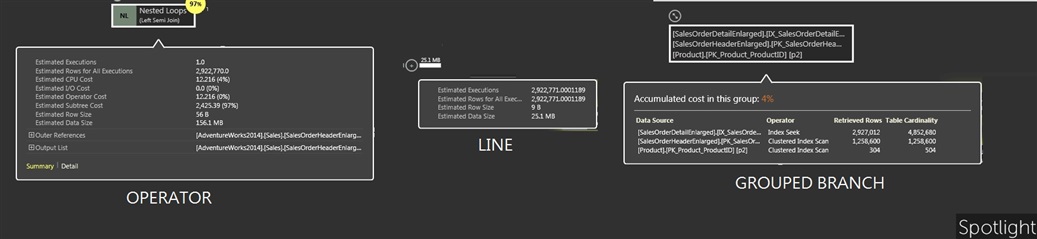
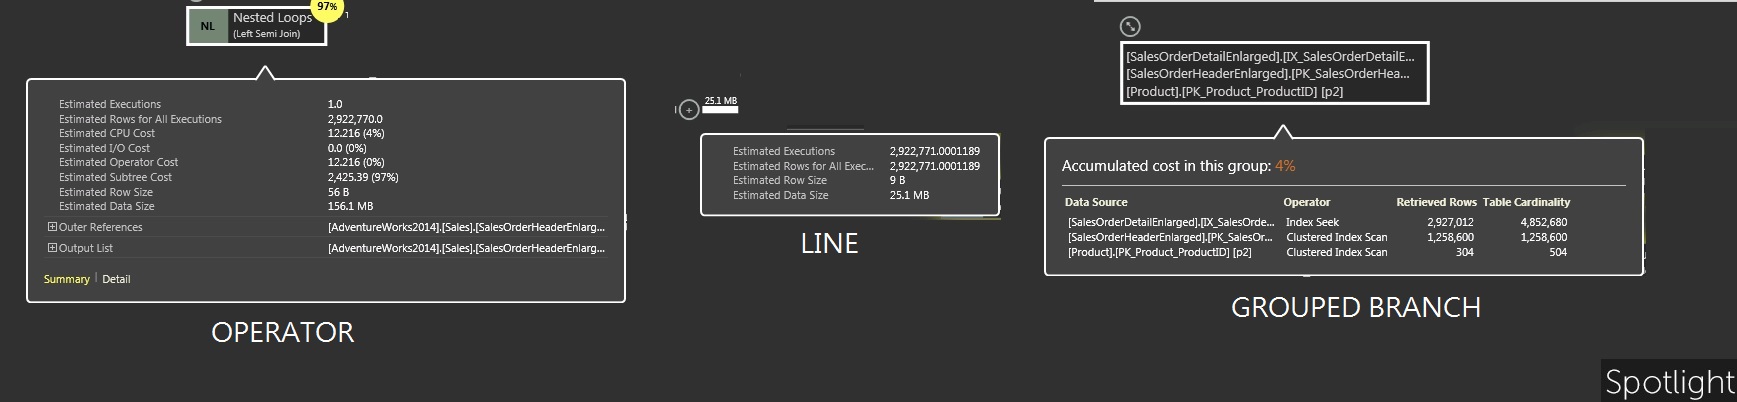
- Tooltips provide summary, detail and warnings data:
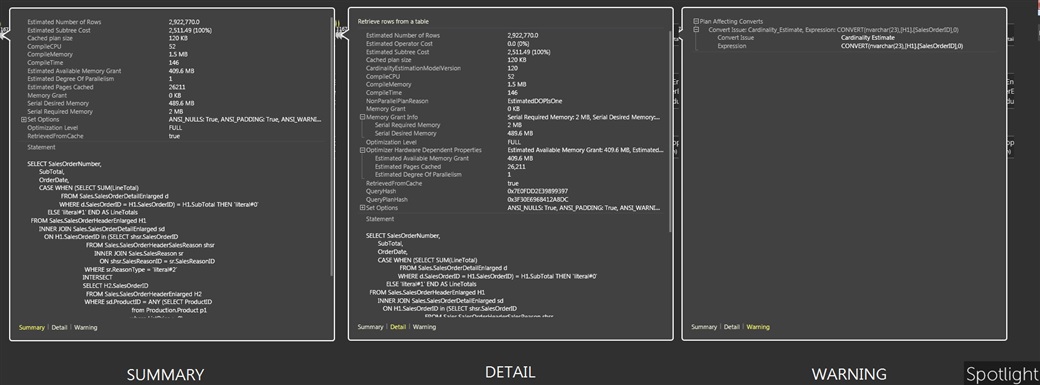

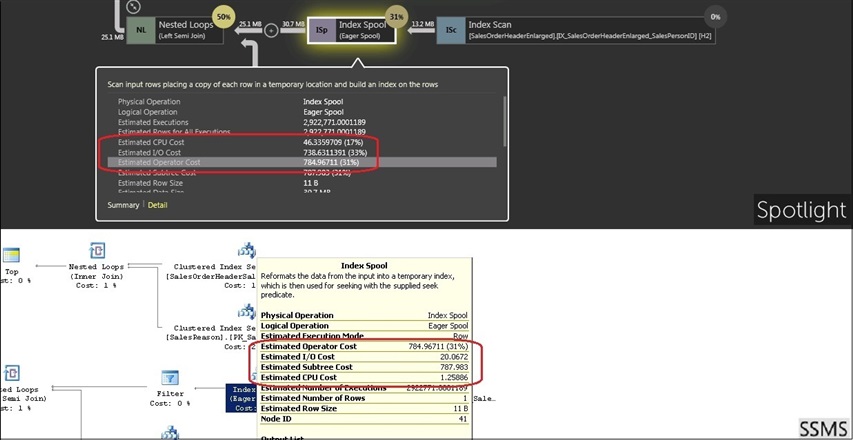
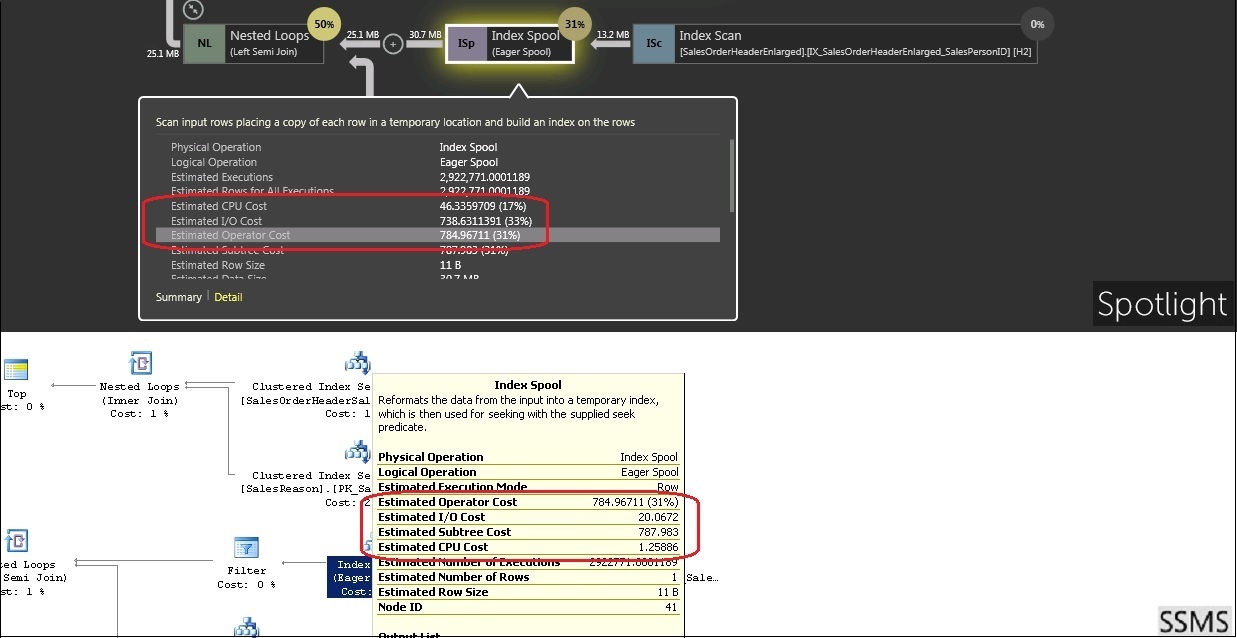
- Cost values adjusted so I/O and CPU values add up to Operator cost value:
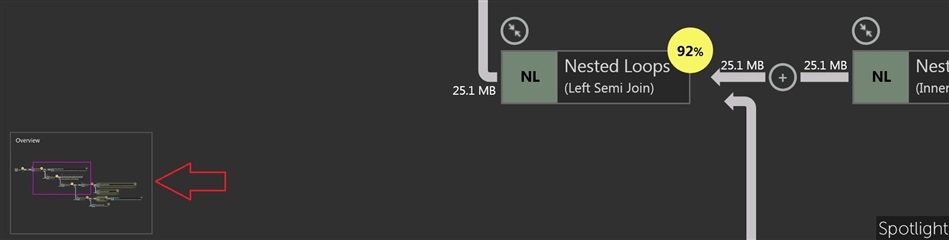
- Global viewer for plan navigation:

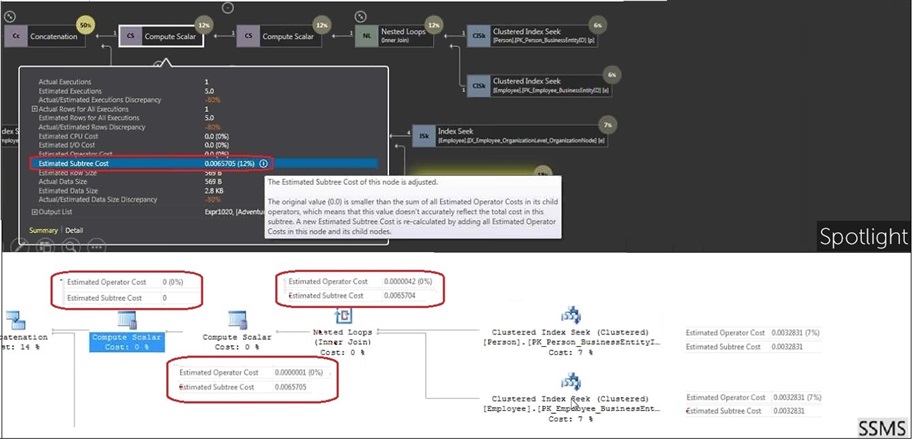
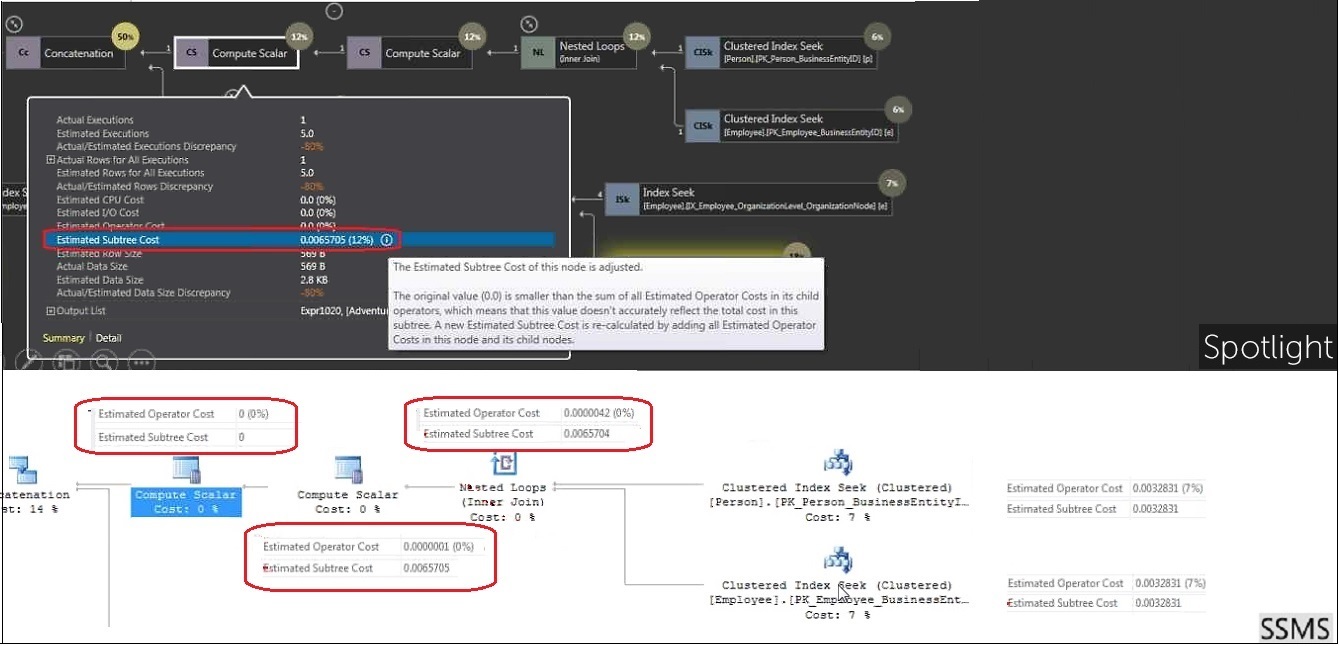
- Subtree cost values adjusted to sum up all costs correctly:
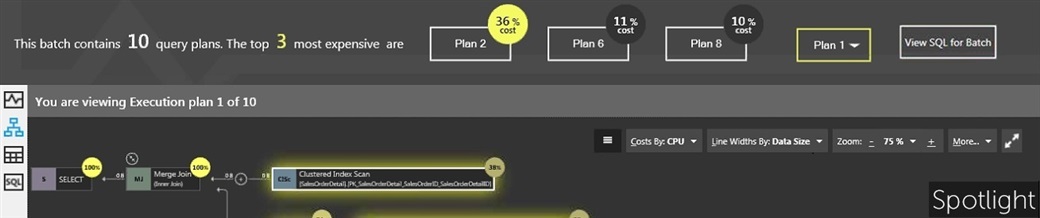
- Automatic ordering of plans based on cost in a SQL batch. View SQL text for entire batch using View Batch SQL option:

Questions? Post your questions on our Community Forums page. Download a free trial edition of Spotlight's SQL Server performance monitoring tool.
