
While your database handles requests from end-users, it starts to consume various resources. With increased number of requests, the database may suffer from resource waits. Excessive wait types and times may lead to performance latencies and degradation.
In order to tune the performance of your database, we must first identify the impacted resources such as CPU, memory or disk.
Spotlight on SQL Server Enterprise can not only identify top resource waits at any given point of time, but also the rooted applications, users and queries. Ultimately, it will lead you to the root cause and eventually assist in resolving the performance issues for good.
The Workload Analysis drilldown of Spotlight can be used to see the distribution of resources across your database system. The resources that can be investigated in Workload Analysis are CPU, Duration, Logical Reads, Physical Reads and Writes.
How to use Workload Analysis:
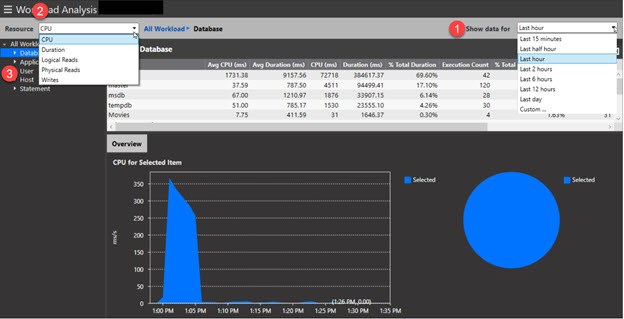
- By default, the dashboard shows the data for the last hour. Use the time frame selector to extend the period from the predefined list or use Custom to enter start and end times.
- Select a resource to filter the activity and isolate the queries consuming the most resource, in this case, CPU.
- Use the dimensional analysis tree to choose a workload item to break down the resource by.
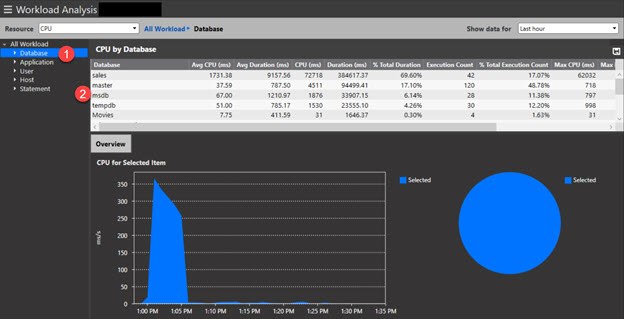
Drill into the Database workload item:
- Choose a workload item from the dimensional tree. In this example, we drill into the Database workload to see the top databases consuming the most CPU resource.
- This first column of the data grid gives a breakdown of the selected workload, in this case, Database. The CPU / Duration Resource columns shows the time (ms) spent by the selected workload (Database) over the selected time frame on the resource (CPU).
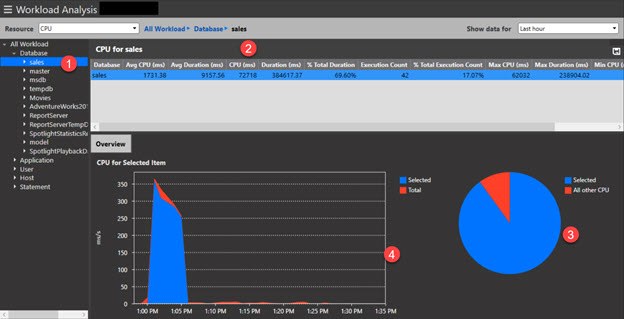
Drill into the Sales database workload:
- Because Sales is the top CPU consuming database, we’ll drill into that database to obtain more details about its activity. This allows us to filter out other resources and hone down to a specific workload and only see activity related to that resource.
- This first column of the data grid gives a breakdown of the Sales database. The CPU / Duration Resource columns show the time (ms) spent by the Sales database over the selected time frame on CPU.
- The pie chart shows the proportion of CPU resource usage of the Sales database compared to other databases.
- The time series chart shows the usage of CPU by the Sales database over the selected time frame. Chart also shows by comparison the total CPU usage of the Sales database by other databases over the selected time frame.
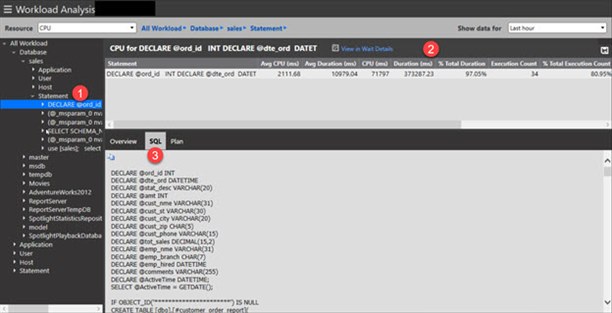
Statements or batches of the workload item:
Drill into Statements to find out the queries within the Sales database with the highest CPU consumption.
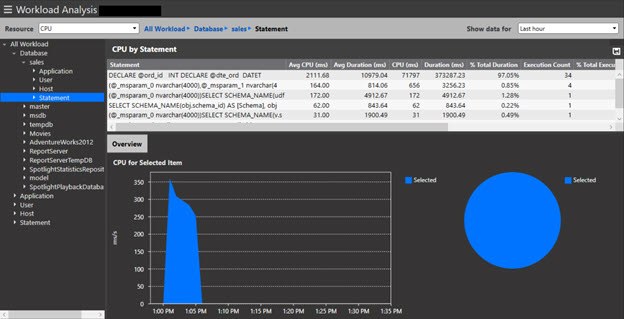
Drill into a SQL query or batch:
- Because the selected batch is highly CPU intensive, it’s important to know which queries within that batch serve as the culprit for the added consumption.
- Use the resource time and execution metrics to analyze the workload consumed by the batch
- Use the SQL pane to review the entire batch statement
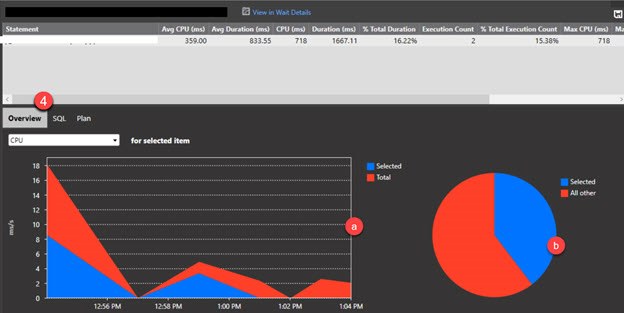
- In the Overview pane:
a. The time series chart shows the usage of the CPU resource by the SQL batch over the selected time frame. Chart also shows by comparison the total usage of the SQL batch by all other SQL over the selected time frame.
b. The pie chart shows the proportion of resource usage of the select SQL batch compared to other SQL.
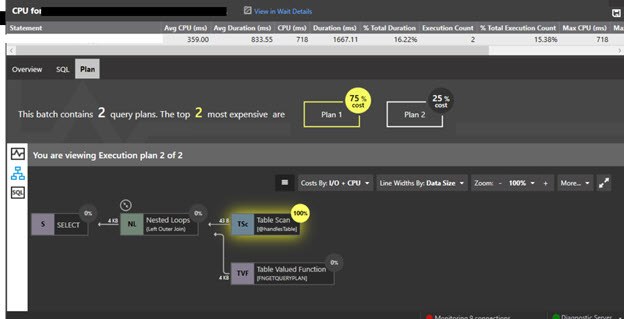
Execution Plan and Cost Analysis
Use the Plan pane to view the query execution plan. The Plan Visualization control provides an interactive way to view your plan. It also provides plan analysis rules including list of operations and objects used in the plan. See the Plan page for complete details.
Tips:
Historical Analysis:
- Use the Playback options to view the Workload Analysis data in the past including historical query execution plans.
View in Wait Details:
- When a statement is selected, click View in Wait Details to show that statement in the SQL Server | Wait Events drilldown. This shows what the query is waiting on.
Export Data by UI:
- Right-click on the Statements workload and use Export all the statements to save all SQL statements to a file (default filename SQLStatementList.sql).
- Export data from each statement node to an .xlsx file for further analysis. Click the Disk icon locate at the top-right corner of the data grid. Data includes: STATEMENT, Avg CPU (ms), Avg Duration (ms), CPU (ms), Duration (ms), %Total Duration, Execution Count, % Total execution Count, Max CPU (ms), Min CPU (ms), Min Duration (ms)
Export Data by PowerShell:
- Export the data in data grid to a CSV file using Windows PowerShell skipping the user interface. See Spotlight help page for complete details.
