I'm surprised by the number of people that aren't aware that our Spotlight Performance Monitoring tool provides a tremendous number of reports. I suspect this is because we do not create the Spotlight Statistics Repository during the initial installation. The good news is it's very easy to configure after the initial installation. The steps are as follows:
- Create the Spotlight Statistics Repository
- Allow Data to be Collected
- View Reports using the Spotlight on SQL Server Enterprise Console
Create the Spotlight Statistics Repository
The initial installation of Spotlight on SQL Server Enterprise creates the Diagnostic Server, the Playback Database, and the Spotlight Console. The Diagnostic Server collects data and stores data into the Playback Database for granular, historical analysis. The Spotlight Console is used to view the collected data. This may seem obvious to many of you, but I don't like to make too many assumptions. Reports are populated using data collected by the Diagnostic Server, but the data is stored into the Spotlight Statistics Repository. This is another database that you must create and configure after the initial installation.
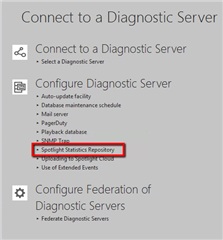
To create the repository, navigate to the Configure->Diagnostic Server menu:
Choose the Spotlight Statistics Repository hyperlink:
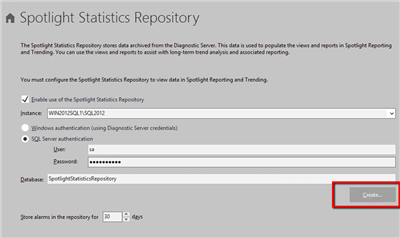
Create the database and ensure that data collection is enabled:
Allow Data to be Collected
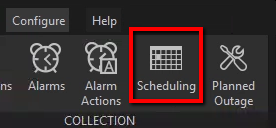
As you might already know, Spotlight collects data on scheduled intervals. The intervals are defined in the Configure->Scheduling menu:
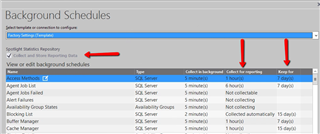
Reporting data is less granular than the data for the Playback database, but it is, by default, stored for longer periods of time. The collection intervals are specified in the "Collect for reporting" column. The data is retained for the time specified by the "Keep for" column:
As you can clearly see, some data points require hours and even days to populate. Once you have adequate data, you can view the information using the Spotlight console.
View Reports Using the Spotlight on SQL Server Console
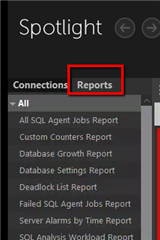
Launch the Spotlight console and navigate to the Reports menu:
**Viewing reports, from the console, requires the Microsoft Report Viewer component. If this is not installed on your workstation, you will be prompted to download and install the component.
When you've chosen a report, you will be prompted to supply the inputs necessary to run the report. These will vary as each report supplies different data. In every case, you will need to log into the Statistics Repository as part of this process.
That's all there is too it! The steps described above, as well as other fantastic information, is documented in the "Reporting and Trending Guide." We provide a link to the document within the Spotlight console:
Please stay tuned for Part II when we discuss customizing and automating these reports. If you're interested in trialing the solution, please download it from the product page: Spotlight on SQL Server Enterprise


