
A UI Query can be used as a shortcut to building a custom dashboard or report. This can save time and frustration by publishing either frequently accessed or hard to find data in an easy to use spot.
In my Introduction to UI Queries post, the building of a simple query to return all SQL Server Agent Jobs was shown.
This post will show how to use that UI query in order to simplify data access when creating a dashboard or report.
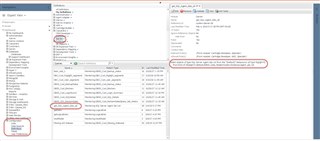
As a refresher, that UI Query was stored in the "Darren" module and returns a list of "SQL Server Agent Jobs".
Let's say we want a custom dashboard with details on all existing agent jobs across all SQL instances. We also want this to be dynamic so if a new instance is added, or an existing instance is deleted, the dashboard will be updated appropriately.
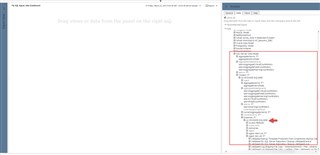
Without the UI query, you have to navigate to each instance and specify the jobs you want on the dashboard. If you add a new instance, you have to update the dashboard. Even navigating on the Data tab to Services -> All Model Roots -> SQL Server Data Model requires that you start with an instance:
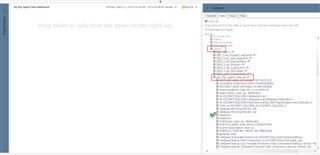
With the UI Query, just navigate to the module where it was created (eg. "Darren"), pick the UI query from the list, and you have access to all of the jobs. The query is dynamic too, so it will show all jobs that Foglight knows about.
Let's say we want a dashboard showing some job details with the last outcome. Simply drag the UI query to the dashboard "canvas" and pick "create a table". You can then select the fields that you want in the table.
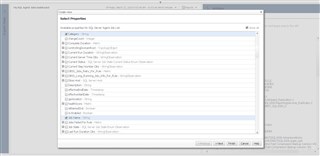
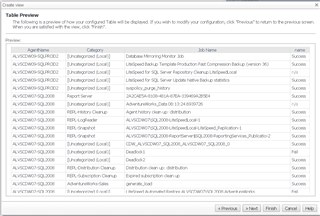
Next takes you to a formatting page for the table, and another next gives a preview of the table. It can take a bit of experimenting, especially when dealing with metrics/observations that have a "Period / Current / Latest" node. For metrics I will normally pick "Period / average" and for observations I will pick "Current / value". The preview shows the data so you can easily see if you got it right and go back if needed.
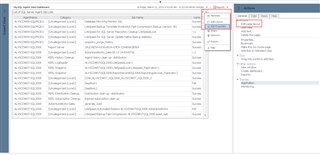
The next page allows you to apply filters and a sort order to the table. Finish takes you to the dashboard. You can edit the layout of the entire dashboard from the General tab, or you can edit the layout and properties of the table from the "down arrow" icon.
Finally, these dashboards can be shared by linking to the URL from the Properties menu. You can even simplify access by using an auth token in the URL as described here.
For more information on Foglight, make sure to visit our website.
