Deadlock investigation

I recently wrote an inhouse document on how to use Foglight and trace Deadlocks. 

Long story short, it appears that our Foglight isn't capturing all the deadlocks that are happening on our busiest production server.  I know this because a fellow DBA wrote a utility that captures our transactional data, much like Foglight does, and houses it in a sql server database.  He was able to use this to show ~25 deadlocks that happened in a 48 hour period when Foglight returned 0 deadlocks.  His utility catches them if they are only a split second long (partial deadlock?) to a total and complete deadlock.

My question is this.  Are there parameters in Foglight that I can set (need to set?)  to capture absolutely ALL deadlocks that happen in a system?  If so, what\where are they? 

I'm on the current version of Foglight.

Please let me know if you have any questions regarding this.

Thanks!!

Parents
  • Hi John,

    I got the following back from our SQL Server domain expert. I'm not sure what version of the SQL cartridge you have, but we made some changes recently.

    The way deadlocks are  captured was actually changed in the previous release of the DB SQL Server cartridge (5.9.4.20).

    Before that version, it was captured by running a trace that “listens” for deadlock events. Basically all deadlocks were supposed to be captured but we saw events when it didn’t.

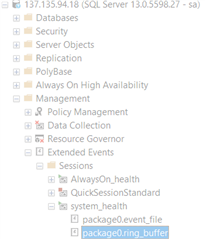
    Starting with 5.9.4.20, collecting deadlock events is done by reading the data collected by the default system_health extended event.

    The deadlock trace is still being used for sql server version 2005.

    Deadlocks will not be captured if user has disabled the system_health session on his instance though.

    You can check that it is enabled via SSMS:

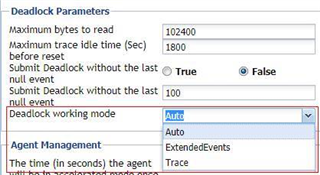
    User can change the way deadlocks are collected through the SQL agent ASP:


    The limits are regarding the number of deadlock events that will be read each time (default 100) and number of bytes to read (100k)

    If user doesn’t see ANY deadlock – I don’t think it is because of these settings. (if they would see some then it could be that these numbers are set too low).

    If the system_health is not disabled (which most people won’t) then this probably needs to go to support.
    If it is disabled, then the immediate remedy will be to revert to using trace as before (ASP setting) while we evaluate the need to support such environments using extended events.
Reply
  • Hi John,

    I got the following back from our SQL Server domain expert. I'm not sure what version of the SQL cartridge you have, but we made some changes recently.

    The way deadlocks are  captured was actually changed in the previous release of the DB SQL Server cartridge (5.9.4.20).

    Before that version, it was captured by running a trace that “listens” for deadlock events. Basically all deadlocks were supposed to be captured but we saw events when it didn’t.

    Starting with 5.9.4.20, collecting deadlock events is done by reading the data collected by the default system_health extended event.

    The deadlock trace is still being used for sql server version 2005.

    Deadlocks will not be captured if user has disabled the system_health session on his instance though.

    You can check that it is enabled via SSMS:

    User can change the way deadlocks are collected through the SQL agent ASP:


    The limits are regarding the number of deadlock events that will be read each time (default 100) and number of bytes to read (100k)

    If user doesn’t see ANY deadlock – I don’t think it is because of these settings. (if they would see some then it could be that these numbers are set too low).

    If the system_health is not disabled (which most people won’t) then this probably needs to go to support.
    If it is disabled, then the immediate remedy will be to revert to using trace as before (ASP setting) while we evaluate the need to support such environments using extended events.
Children
No Data