

I'm trying to create a report/dashboard with multiple databases that shows the user defined collection data. I created a User Defined Collection on each Database. Now I'd like to create a simple report/dashboard with these columns:
Database Name…
I'm trying to create a report/dashboard with multiple databases that shows the user defined collection data. I created a User Defined Collection on each Database. Now I'd like to create a simple report/dashboard with these columns:
Database Name…
We have recently migrated from Quest's Spotlight (for databases) to Foglight (for databases).
In doing so we have run into a few challenges: The most important of which for us is delegating (non administrative) access.
Spotlight had a fairly mature…
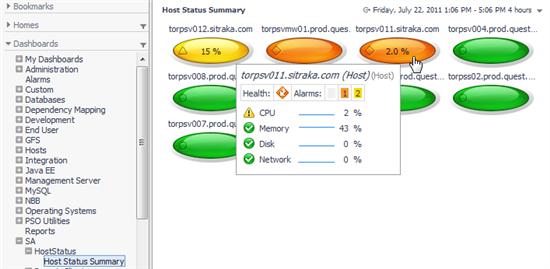
Hello I request your support, I am trying to create a table of disk capacities where I can calculate the monthly growth and the percentage, but I cannot obtain the weekly value of growth rate, additionally this table should contain the percentage of CPU…
Hi,
could somebody give me a hint on How to create a function to apply it to a Row-Oriented Table, so it takes as an input the values of the rows of one column and then the output is binded to equivalent rows in another column?
I am unable to do this…
I'm looking to create some daily run reports to show the previous 24 hour stats with the following parameters:
API integration, dashboard, and agent customization on Foglight platform
Event Registration: www.quest.com/.../vroom-foglight-dev-camp-20178128488
Submission Guideline:
Register at https://devpost.com/ using your Github or LinkedIn account
Form your team …
Hi,
as all Foglight for Virtualization Standard Edition (FVS) customers are going to change to Foglight for Virtualization Enterprise Edition (FVE), they would like to see the FVS dashboards in FVE. In the attachement you can find a cartrdige which contains…
Hi Foglight Expert,
I want to create a dashboard to achieve below requirement
1. one part of the dashboard would show the SQL instance that status is down
2. the second part show the SQL Instance that Agent service is down
3. the third part would show any…
Hi,
I have custom dashboard that use Grid Layout inside Iterator, this works well as an Dashboard. But i have a need to include it inside an custom report. But the generated pdf only show blank page. Why is it? How to show it properly inside pdf? Please…
Hi all
I'd like to suggest you the recipe for creating jellybean (or spinner) dashboard based on cartridge from Brian Wheeldon. In his post he provides cartridge with dasboard like the image below:
Unfortunately, I couldn't install those cartridge…
I have a row-oriented table that uses the WebSphereServer topology for the data. There are columns for some of the metrics. The table is pulling over 60 instances, and so it takes a while for the page to load. The user would have to wait for the entire…


