
The original “Just the Facts” blog I discussed how to see just the Alarms displayed in “Spotlight Today” within Spotlight on SQL Server Enterprise. Now it is time to see what we can do with those Facts or Alarms. Spotlight comes with factory settings, these setting can be customized to your environment. However it would be advantageous to determine what the alarms are telling us as they are triggered.
Over the years I have installed Spotlight on SQL Server into many SQL Server environments. What we first encounter is that many installations immediately have fatal alarms that trigger on the first connection to a SQL Server Instance. Therefore, it would be beneficial in determining if that alarm is and the default or factory setting needs to be adjusted to suit your environment. The best method would be to “Diagnosis” the alarm and assess the validity.
I will provide you with the step of assessing an Alarm by using the “Spotlight Today” dashboard. I can’t do every alarm so I will focus on a “Buffer Cache Page Life Expectancy” alarm. This alarm is quite common and appears in more than one connection. So let’s get started:
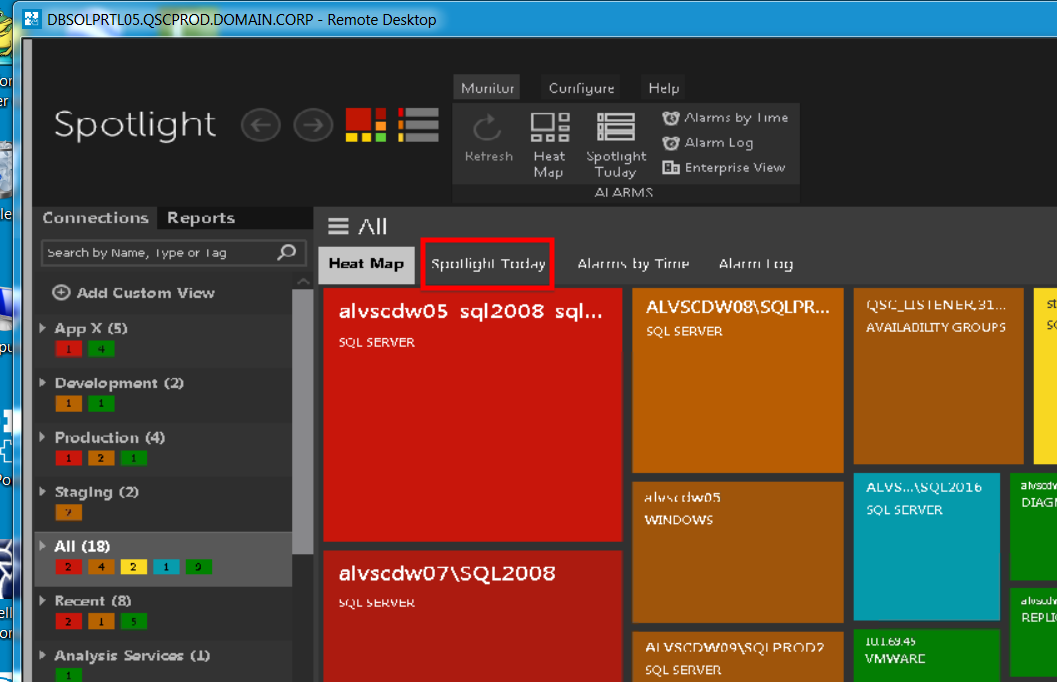
The method I will be using to navigate and diagnosis an alarm will be the Spotlight desktop client. First we need to change the default display which is the HeatMap and we can now change this display by selecting the tab titled “Spotlight Today”.
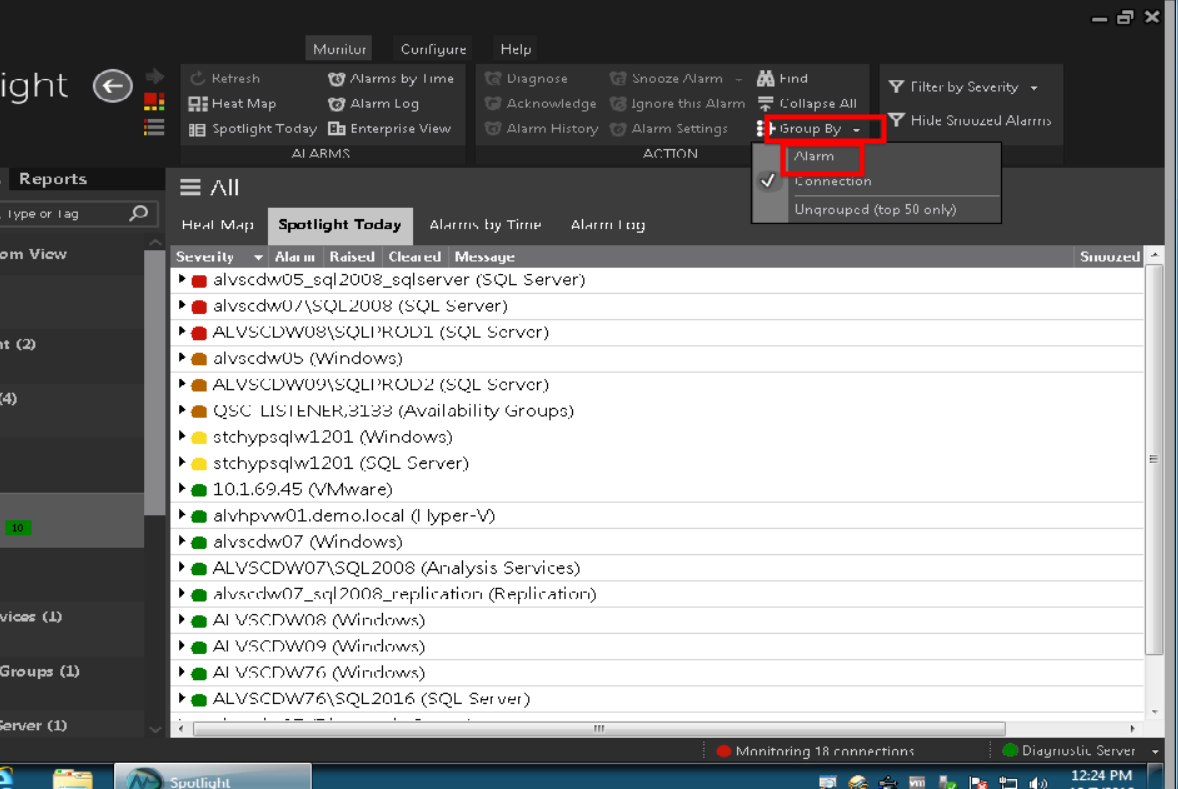
Upon selecting “Spotlight Today” we can alter the grouping of alarms from connection to alarm. The default display will be order by severity and listed by connection. I would recommend changing the display to order by alarm listed by severity. Below I selected the “group by” field from the navigation ribbon and select “Alarm”.
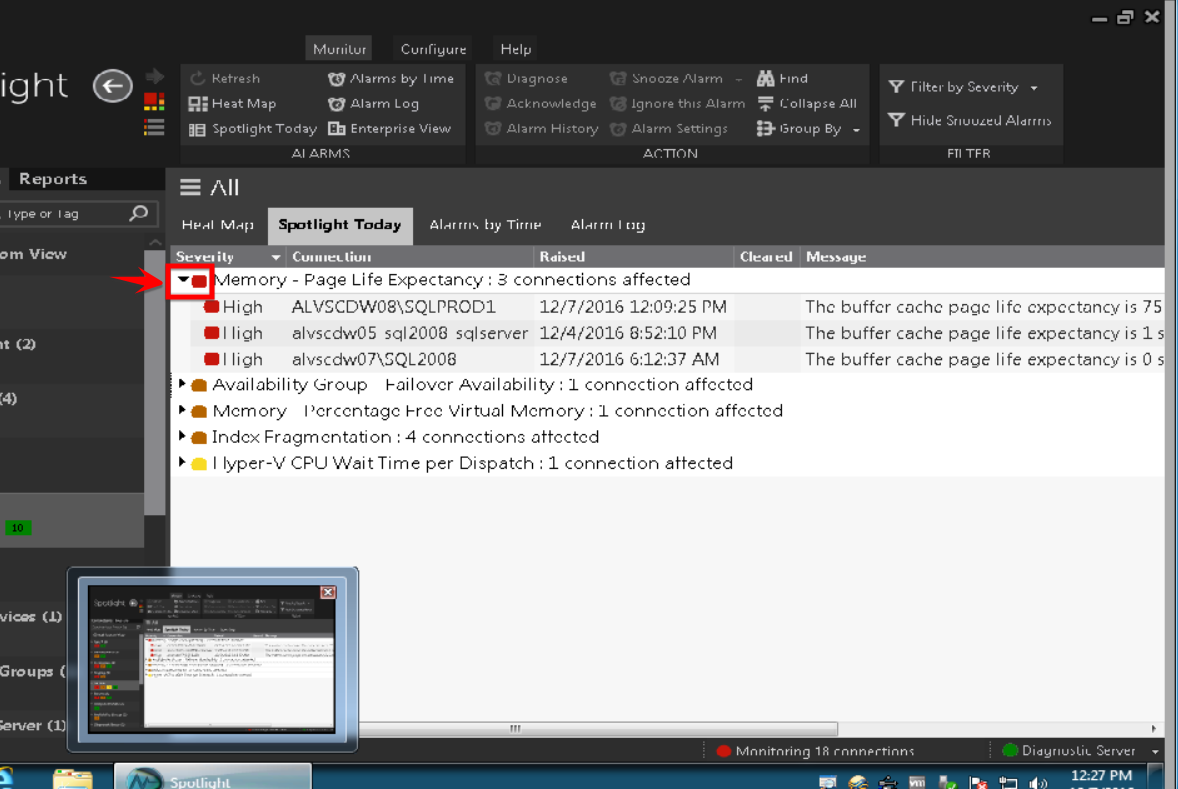
Once you change the grouping the display will look similar to the below image. This dashboard is displaying alarms trigged by severity. The very first alarm is a “Buffer Cache Page Life Expectancy” alarm which is present in three instances that are being monitored.
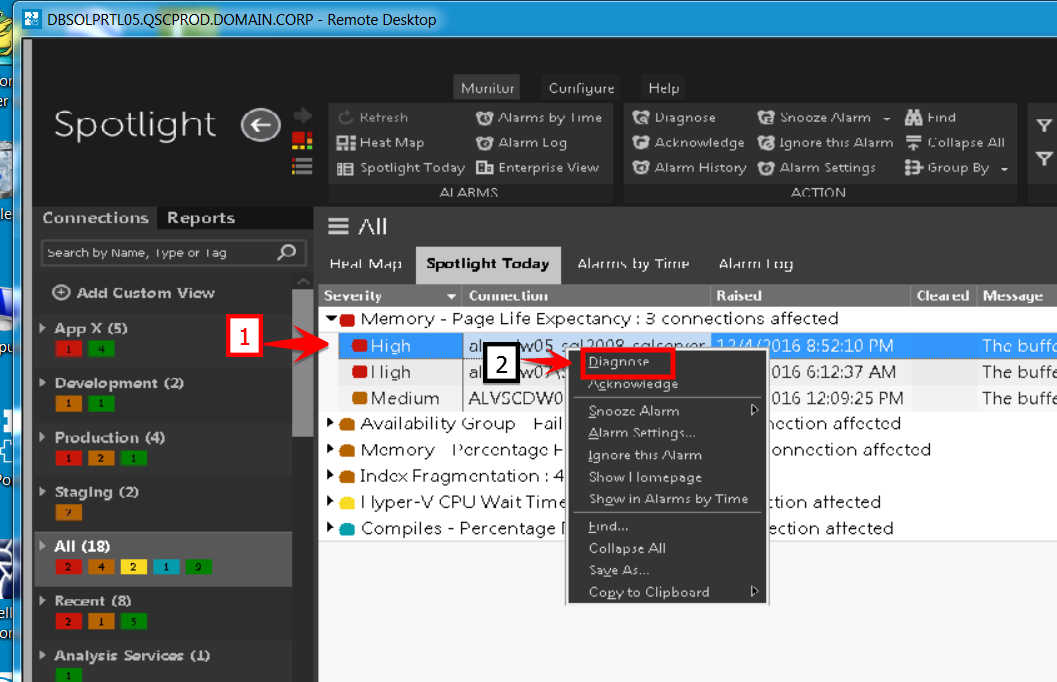
Now let’s investigate this alarm. First select one of those alarms, by a right click of your mouse you will be presented with a menu of options. Select the top option which is “Diagnose”.
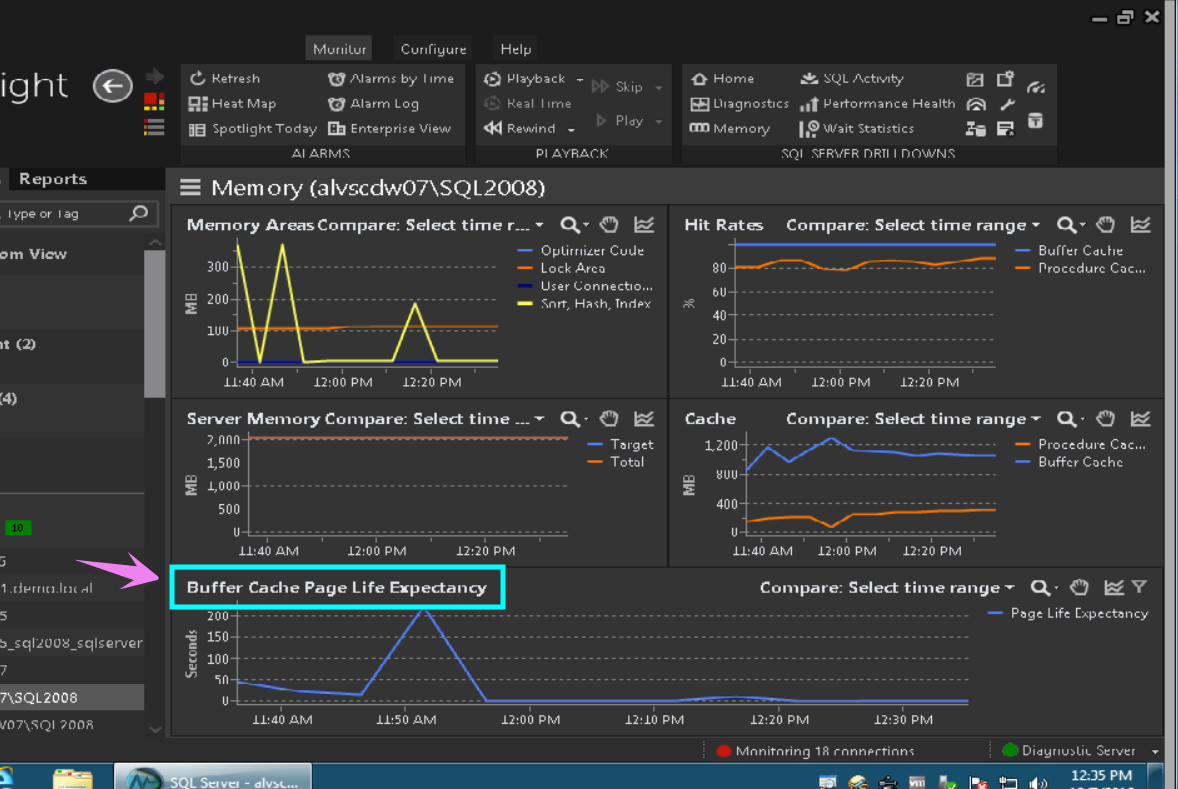
This selection will navigate you in context to the “Memory” drilldowns associated with the instance of the last hour. The bottom graph displays the “Buffer Cache Page Life Expectancy” over the last hour.
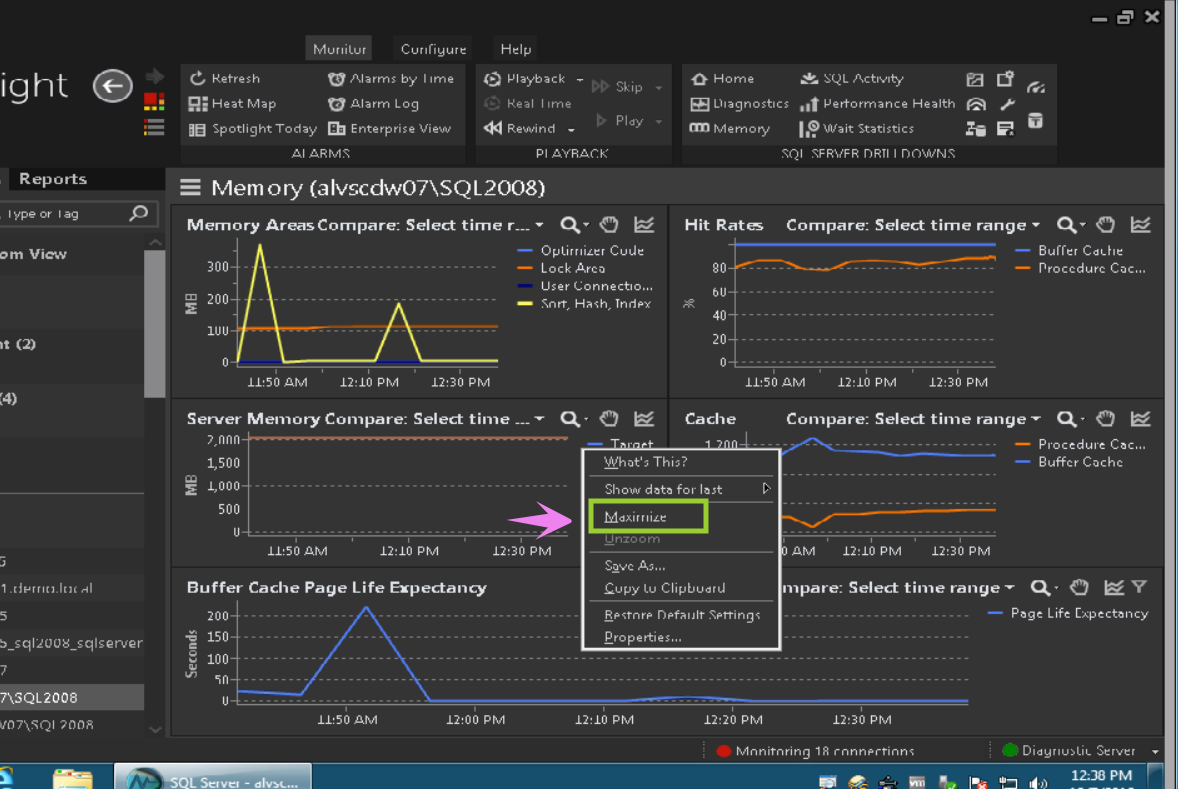
This display will allow you to further investigate this alarm for a longer period of time and allow you to maximize the display. This tool uses the right mouse button assist in altering the size of the display, so by selecting “maximize” the display will change.
The display size is not the only feature that can be altered within this but the amount of time to assist the question when did it start and how long is the duration.
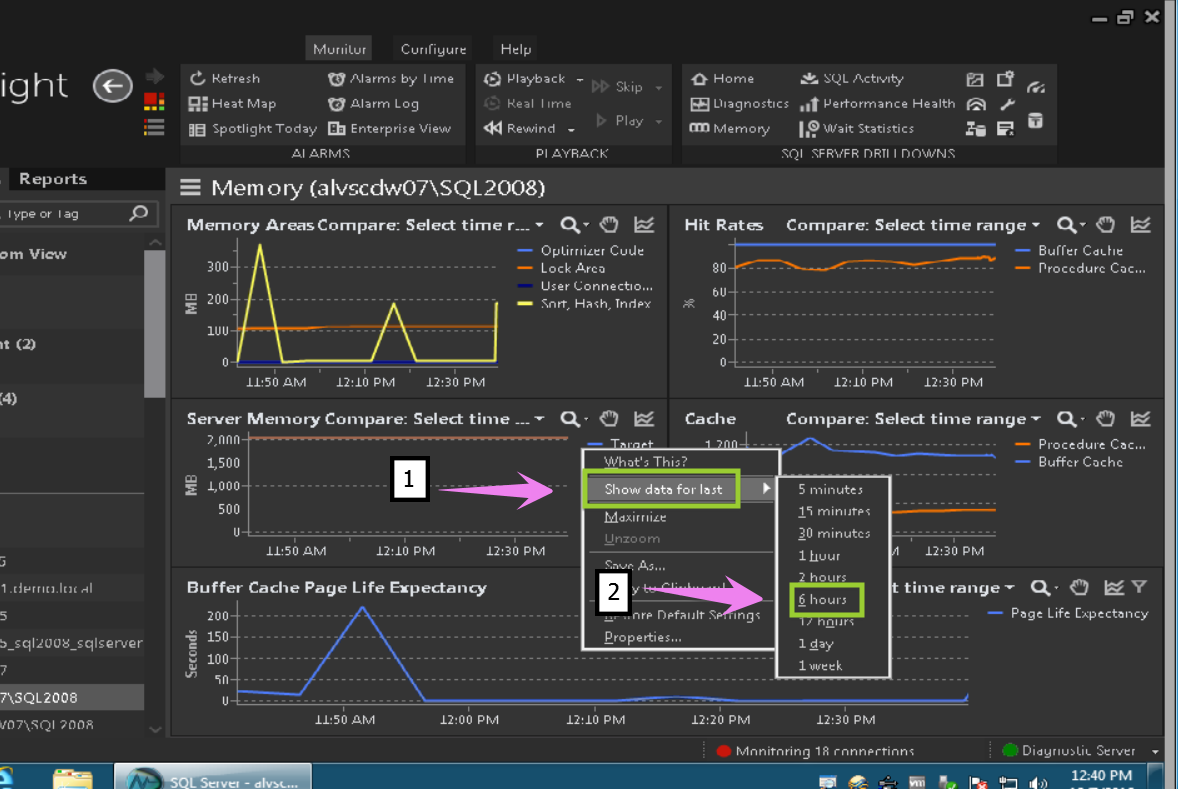
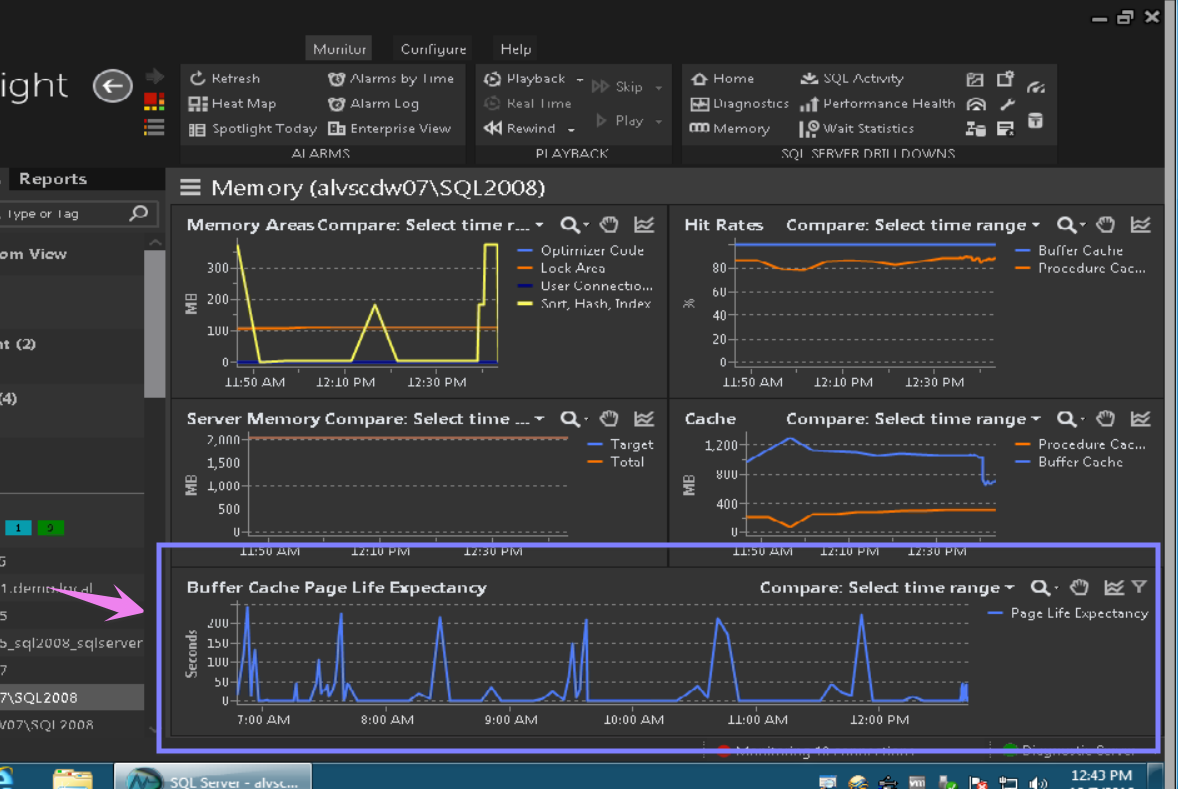
Above I selected a 6 hour window to begin my investigation.
The method of using “Spotlight Today” is just a suggestion. There are a couple of other ways to navigate to this type of display. I only suggest this for a good starting point and a way to stay focused when presented a series of alarms.
I will continue this series of Just the Facts! Looking at what caused the alarm to trigger and the use of alarm snoozing.
