

How data is stored in databases is generally driven by the concepts of normalization – where you try to reduce data redundancy and improve data integrity. This has been the foundation of relational databases since their inception. However, when data is broken down into 3rd normal form (or Boyce-Codd normal form) it moves further away from how it needs to be presented in reports or dashboards.
In my previous blog we looked at how Toad Data Point can help you discover where, and how, your data is stored:
Once you've accessed your data sources, found the data you need and created a dataset, you now need to ensure that you’ve retrieved accurate data. The data you’ve retrieved, or the way you retrieved it, may lead to inaccurate, duplicated or “dirty” data. Now we’re going to look at how Toad Data Point can help you ensure that your data is accurate. Spoiler alert – it probably isn’t!
With modern day applications a significant portion of the data entry has been passed off to the “end-user”. For example, if you want to access a website or application you may need to provide your details, such as postcode, email address and telephone number. Often, we just input a series of letters, numbers and characters that will satisfy the application’s criteria. This leads to applications storing inaccurate and “dirty” data and, as a data analyst, you need a way to identify it so you can clean or ignore it.
When you’ve created a dataset in Toad Data Point, you can send that dataset to the Data Profiling module. The Data Profiling module helps you identify anomalies in your dataset. There are several components to it, as we will investigate below:
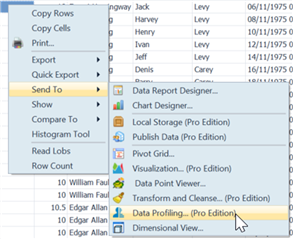
To send your dataset for profiling, right click on the dataset results then go to Send To | Data Profiling:
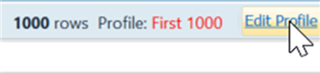
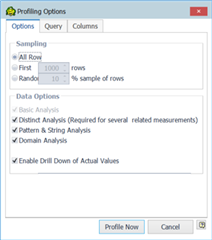
When Data Profiling launches, by default it will profile 1,000 rows. If you want to profile your entire dataset you can do so by clicking Edit Profile, then selecting All Rows:
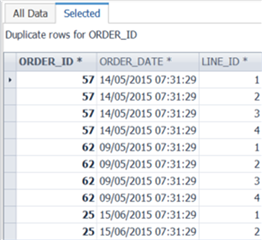
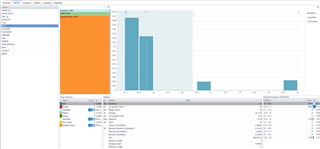
On the Summary tab, you will see a breakdown of each column visualized in a chart. The chart, as seen below, is very useful at identifying anomalies. In the example below, I was of the impression that OrderID is unique, but I can see there are non-unique and repeated rows. To see those repeated rows, I can simply double-click on the orange section of the OrderID bar, and the repeated rows will be listed for me.
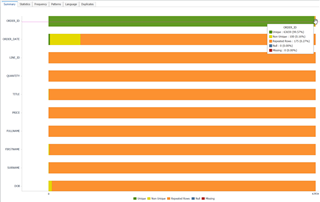
This shows up something interesting – the Order ID is correctly not always unique. To get the unique value of each row (Primary Key) I need to use OrderID + LineID.
Moving to the Statistics tab – if you need statistical information about your data, then this tab is worth the license cost alone. Simply by selecting the column on the left panel, you will instantly get statistical analysis such as median, max, min, average, mode, quartiles, sum, standard deviation, etc. You can also quickly graph the Value Distribution and Percentiles for each column. In my opinion, the level of detail this tab gives you is really impressive. The time saved compared to calculating these values manually is significant.
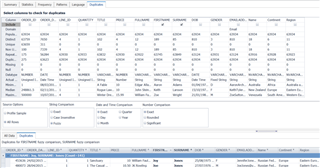
The next tab I want to highlight is Patterns. Very simply, this looks at the patterns of the text/string columns in your data set. I see customers using this a lot for structured columns such as email address, post code, telephone number.
It will display the Word pattern (are letters, number, punctuation, spaces in use) and the Letter pattern (the order in which letters, numbers, punctuation, spaces are used).
In the example below, it clearly identified anomalies in my email address field, where I have email addresses that contain spaces, making them invalid.
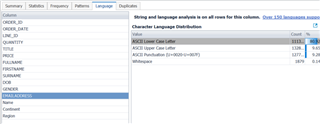
The Language tab offers similar information to the Pattern tab, this time detailing the character distribution used in text/string columns. Again, the email address is showing whitespaces in use.
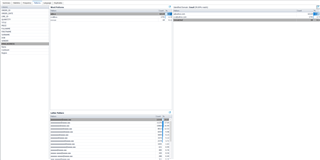
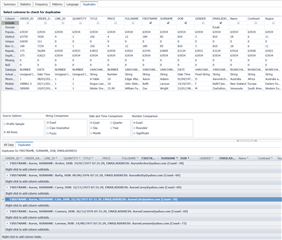
Finally, the Duplicates tab allows you to search for duplicates in the dataset. You simply select the columns you want to search, and it will search for duplicates across all the selected columns. In the below example I’m searching for Firstname and Surname duplicates. Since they are “string” columns, I’m selecting a fuzzy search. This tells the Toad to look for similar names, encapsulating potential spelling mistakes on data entry. The below screenshot highlights “Joy Jones” and “Joe Jones” as a potential fuzzy duplicate since there is only 1 character difference in their full name. However, I know this isn’t a duplicate, so I’ll add additional columns to make my search more refined.
Below I’ve added “Date of Birth” and “Email Address”, which I’m confident will give me a unique person.
Having profiled my dataset, identified anomalies that I need to fix in the source application and/or revise my query, I can now proceed with confidence knowing that the data I’ve retrieved is accurate.
For more information on Toad Data Point and to download a trial, go to our product page: https://www.quest.com/products/toad-data-point/