
Foglight reports can be extremely useful in broadening the reach of whatever monitoring you’ve got set up. Reports can be the mechanism for delivering PDF or Excel summaries of important information on the health and capacity of your databases, etc., throughout your organization. Many of these reports might be run manually, while others are set up to run on recurring schedules.
However you choose to use reports in Foglight, especially the custom variety – the reports you’ve created - you can consider some fine-tuning to make them even more useful. You can, for example, design your reports to prompt for input parameter values each time the report is generated. Do you want to report on some SQL Server key performance indicators? Do you want to be limited to running the report for one and the same instance every time? Maybe; but if not, it’s a perfect situation for parameterized input.
You might have heard of parameterized inputs in Foglight. We at Quest have delivered webcasts on the topic before (here’s a webcast on Reporting, Broaden the Reach of Performance Insights Using Reports: Play recording). There are other Quest Community blog and forum posts on the subject, certainly. Let’s explore parameterization a bit here, using an example that’s shown on that webcast linked above – using two parameterized inputs to add even more control of which instances, databases, servers, whatever, actually get displayed on your report each time you run it.
Example: DB File Growth Report (instance and database selection)
As an example of a report requiring two parameterized inputs, let’s look at a request we recently received from a customer. Here are the essential elements of what they wanted to see on a report:
- The file growth over any selected time period.
- The growth of database files on a SQL Server instance, visualized by database – not one total of space usage across the instance.
- Only specific databases – not all of the databases for the chosen instance.
In fulfilling this request, the DB Growth report in the Quest Community supported “DB Expansion Pack” came close (https://www.quest.com/community/products/foglight/f/custom-dashboards-and-scripts/418/foglight-database-expansion-pack). That report shows total file growth by database:
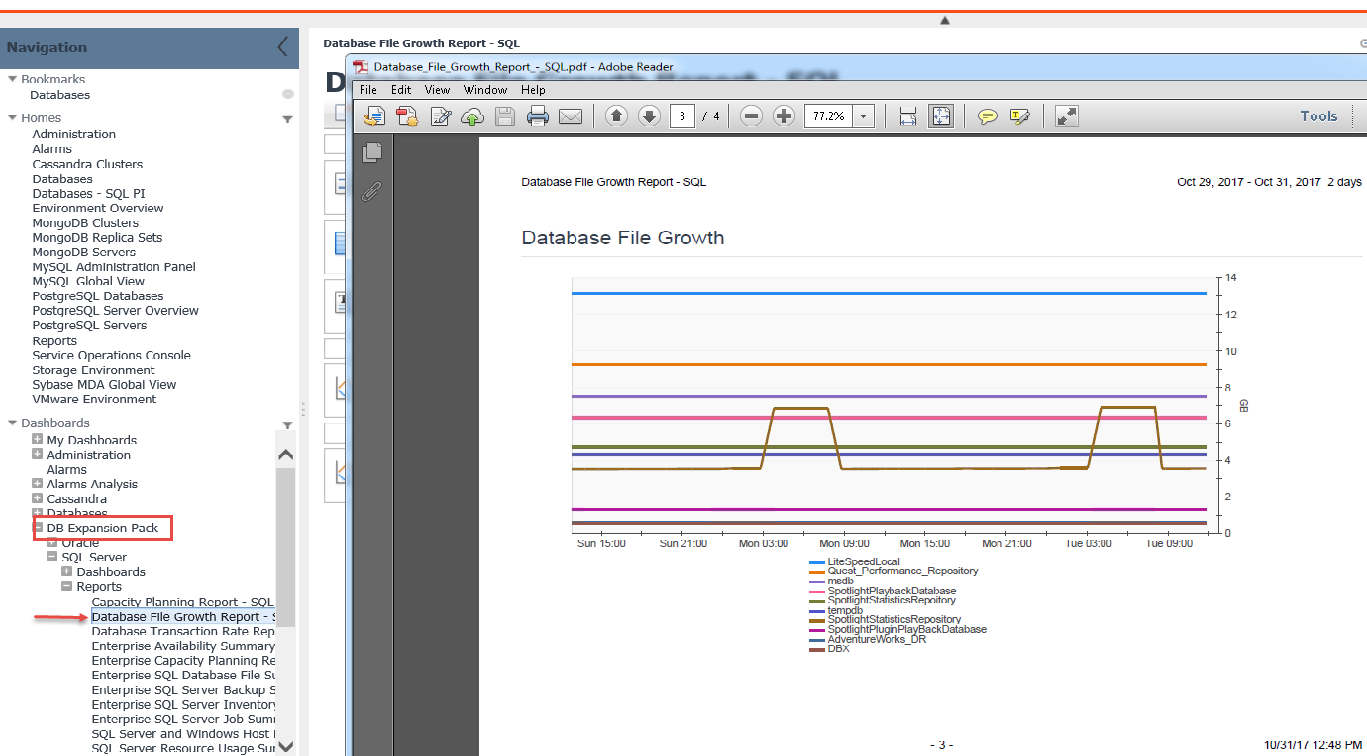
This report did fulfill the first two requirements listed above. A single instance can be selected at run time, and any time period can be included on the report – assuming the historical repository still contains the data. While close to what the customer needed, this report didn’t fulfill their requirement #2 above – to see growth for only selected databases (or, conversely, to eliminate certain databases from the report).
Creation of a new custom report
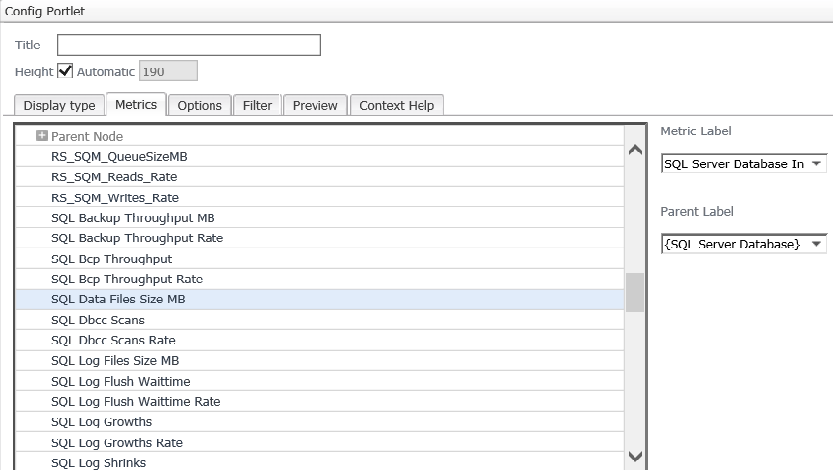
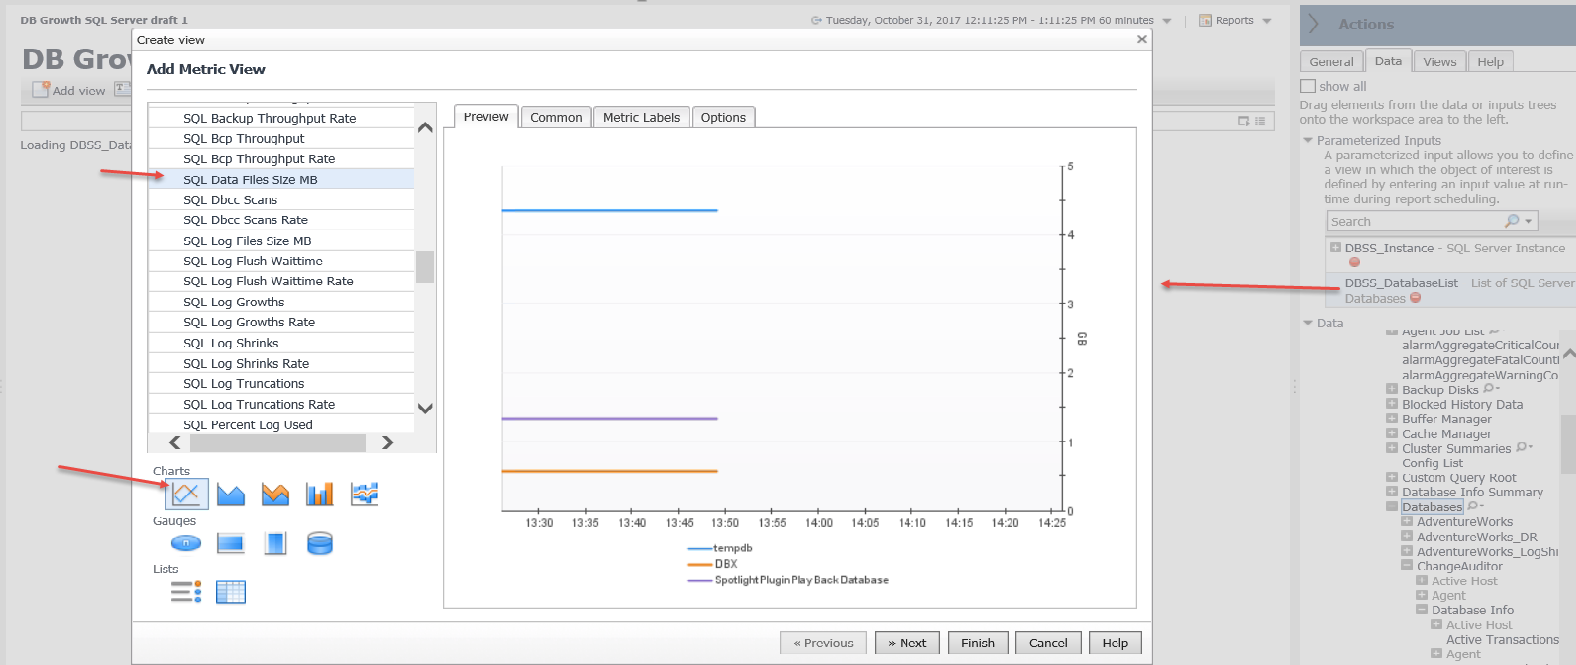
To fulfill all three requirements, we set about trying some things in a Foglight drag-and-drop report. SQL Server instance information would be chosen for display on the report, and we found the metric we needed (the same one used on the DB Expansion Pack report shown above), SQL Data Files Size MB, located under the instance’s ‘Databases’ – ‘Database Info’ data tree branch:
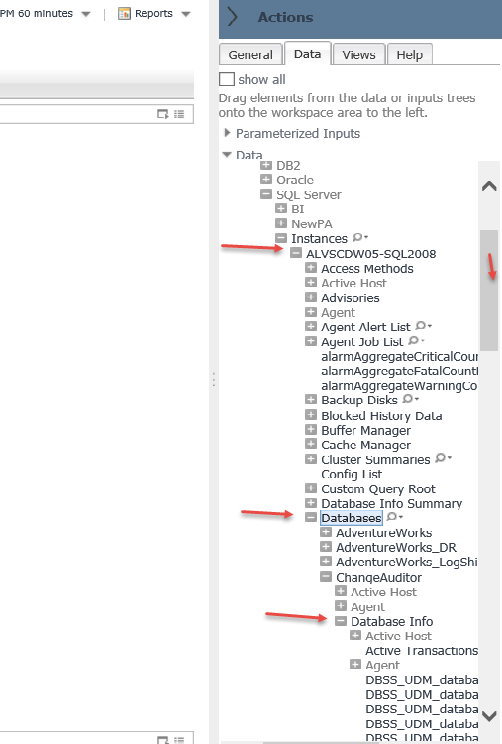
The metric "SQL Data Files Size MB" below will be chosen for the report’s growth chart:
To fulfill the requirement that a selected instance be displayed on the report each time it is generated, we’ll need to provide that selectivity by dragging a SQL Server instance up to the “parameterized inputs” area on the Data tab:
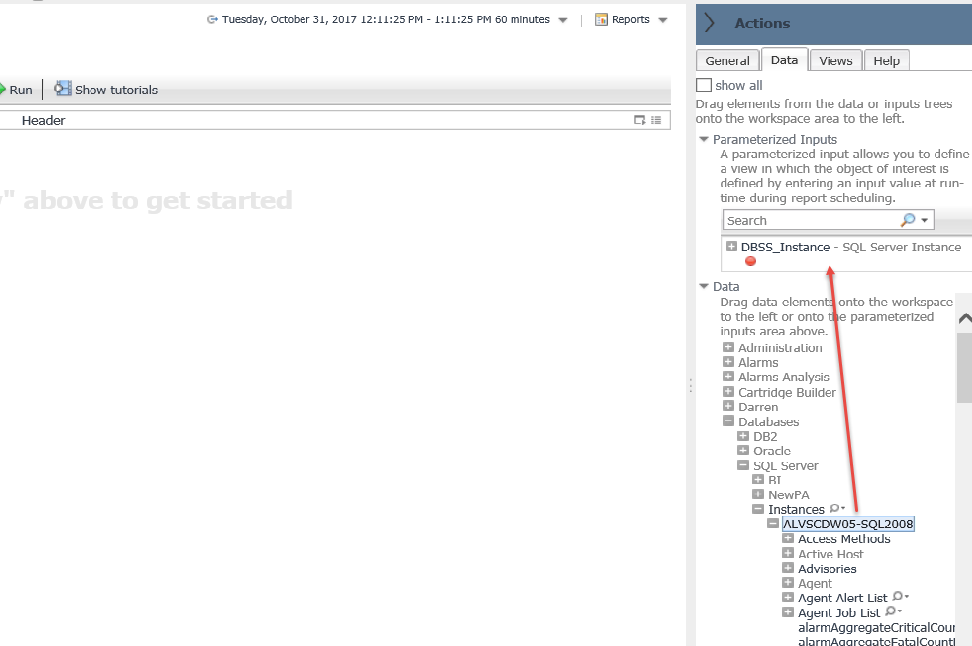
Once DBSS_Instance is a parameter, whoever runs the report will be prompted to select and instance. If selection is made, the default instance will be used – in this example from the screen capture, ALVSCDW05 will be used.
So there, is our first parameterized input – the instance selection. Here is the new prompt:
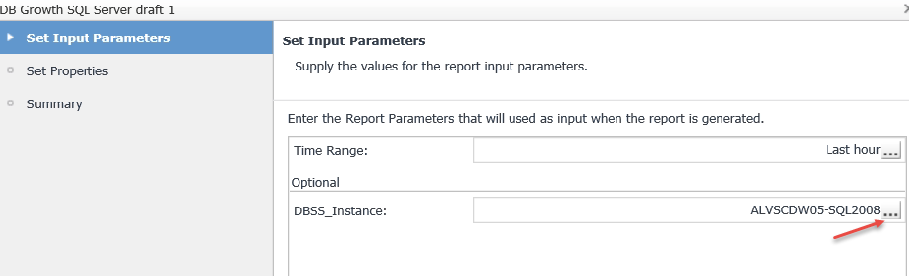
Clicking the ellipsis button allows selection of any SQL Server instance that we’re monitoring with Foglight.
But, we’re getting ahead of ourselves a bit. First we need to add that metric, “SQL Data Files Size MB” to our still-blank custom report. Where should we “drag” it from in the data tree on the right-side Action panel?
- From the instance node that we just dragged to the parameterized inputs area?
- No – that won’t fulfill our requirement to display a size value for each database separately.
- From the Databases – Database Info node of the tree under the instance?
- That’s more like it. But still not quite what we need, because we want to be able to select the databases at run time – not simply have every database’s file size metric displayed every time.
We’re going to need to parameterize the databases. Remember, when you think “selection” on a report, we’re generally referring to “parameterized input”. Instance name will be one of our inputs, and time period will be another. We need a third – a list of databases that we can revise or provide every time the report is generated. A second parameterized input is needed.
Adding one more parameterized input: List of Databases that can be revised at run time
If we add the desired metric by dragging it from Database Info, either from the instance selector or from the lower part of the data tree on the Action panel, the effect will be to see a file size metric graphed for every database on the selected instance. Sometimes that might suit the report receiver, but it does not fulfill the requirement of being able to selectively add databases to the report/graph.
The only way (using our drag-and-drop reporting facility) to have a line on the graph for only selected databases is to add the list of databases to “Parameterized Inputs”. And not only do we need the list of databases as a parameterized input, we also need to drag the metric for the report from that “list of databases” parameterized input. That will ensure that we’ll be prompted, and whichever databases we select for the report will be the only databases with a corresponding line on the plot chart.
Here’s the final report parameterized inputs, after dragging “Databases” from under a SQL Server instance up to the “Parameterized Inputs” section:
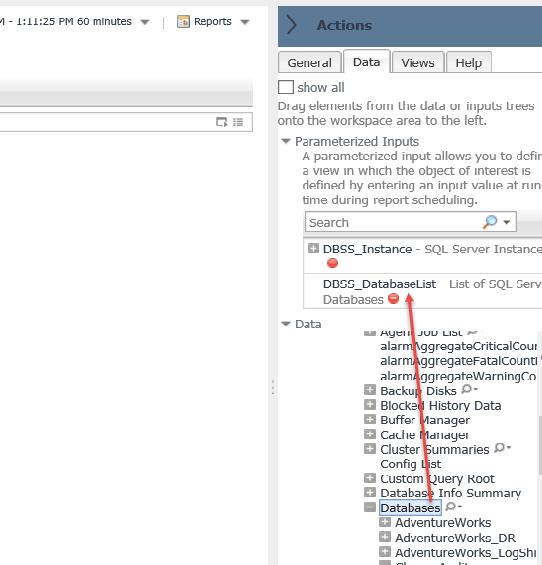
We drag the metric onto the report from there:
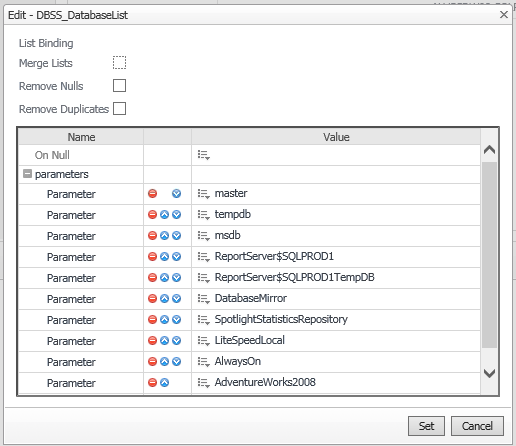
The effect of this is to provide us with a list of databases when we run the report, from which we can remove some database names if we choose to – then the report won’t include them. The list dialog provides a red “remove” button, as shown here;
IMPORTANT: The metric “SQL Data Files Size MB” must be dragged over from the parameterized ‘list of databases’ (then, find “Database Info” to locate the metric) to allow the selection of databases to display. If we simply drag the metric over from the instance or from the lower part of the Action panel data tree, all the databases on the selected instance will appear on the graph every time…there won’t be any run-time selection possible.
For more information about Foglight, please visit the product website page here: http://www.quest.com/foglight/.
You can ask questions about the material in this post, or offer your insights and feedback, by joining us on the Foglight Community forum at: http://www.quest.com/community/products/foglight/
