
The backend repository for the Foglight Performance Investigator is based on Infobright, an analytics engine for machine generated data. However, you can connect natively via anything that can connect to PostgreSQL.
The schema reference for Performance Investigator is available for Oracle and SQL Server from support. But how do we get setup to start building queries?
We'll need some tools. Naturally, I prefer something from the TOAD family. TOAD Data Point supports PostgreSQL, and a free trial is available for download. You can also use other available development tools. I like pgAdmin as well.
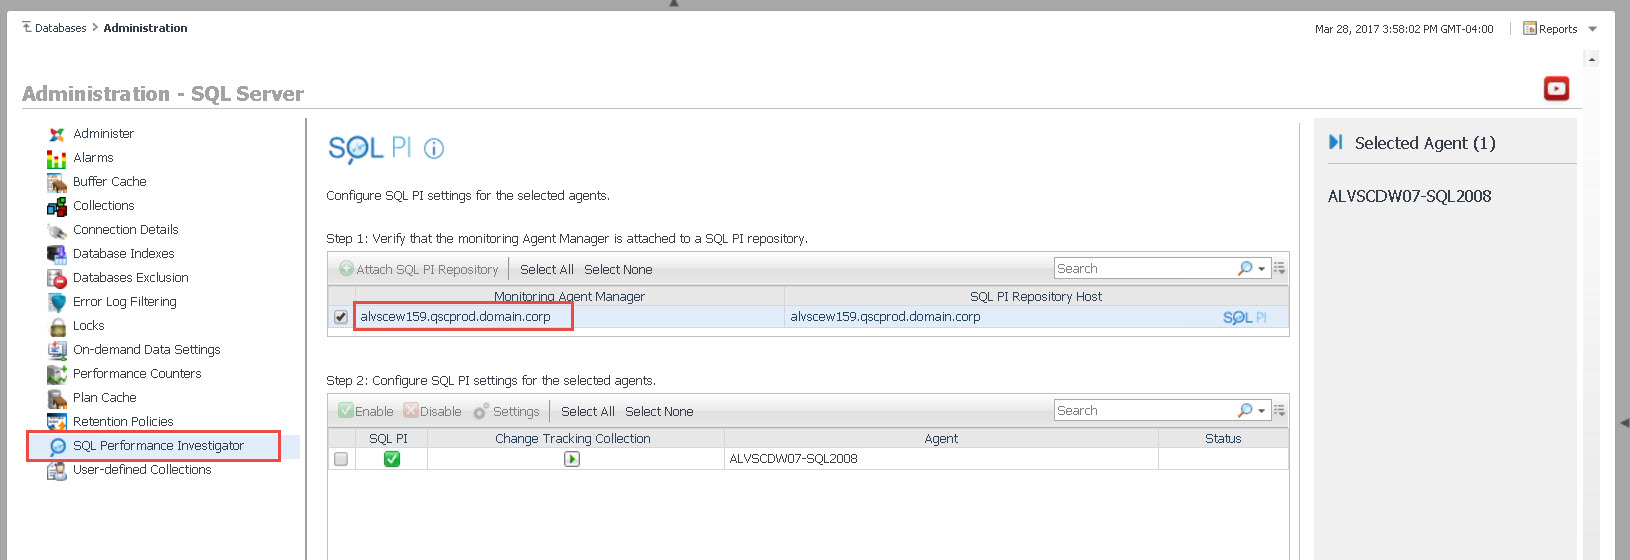
To get started, you will need the host name where the PI Repository is running. You can find that in Foglight from the Databases dashboard by selecting one of your Oracle or SQL Server instances, then going to Settings -> Administration -> SQL Performance Investigator.
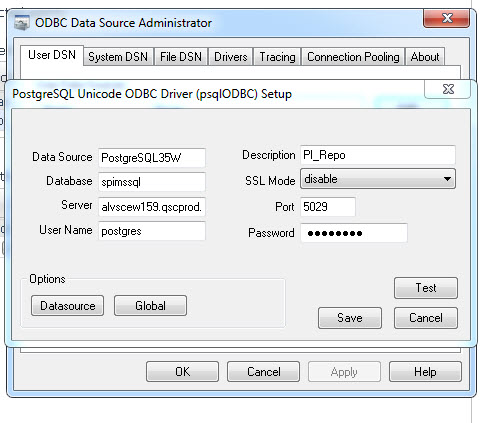
TOAD Data Point uses an ODBC connection for PostgreSQL, so you will need to download that too. The 64-bit version is linked but others are available on the postgresql.org site. The ODBC connection needs to be setup for TOAD. pgAdmin uses an embedded driver.
In addition, the following fields are needed for either connection:
Database = spimssql or spioracle
** Note - this is the default database name. Certain operations (eg. upgrade) might append a unique GUID to the database name. For a tutorial on finding the actual name, visit my colleague Jason Hall's post on how to link the PI repository to SQL Server, so you could query it with a Foglight user-defined collection.
Username and password = postgres
Port = 5029
Once connected, you can start exploring the tables. These are also well documented in the guides that were linked above.
With TOAD Data Point, you can use the Object Explorer. Double-click a table, and then switch to the Data tab. The pass_instance_dim ( and spiora_instance_dim table for Oracle) is important, as it holds the additional fields that other tables reference via the instance_key.
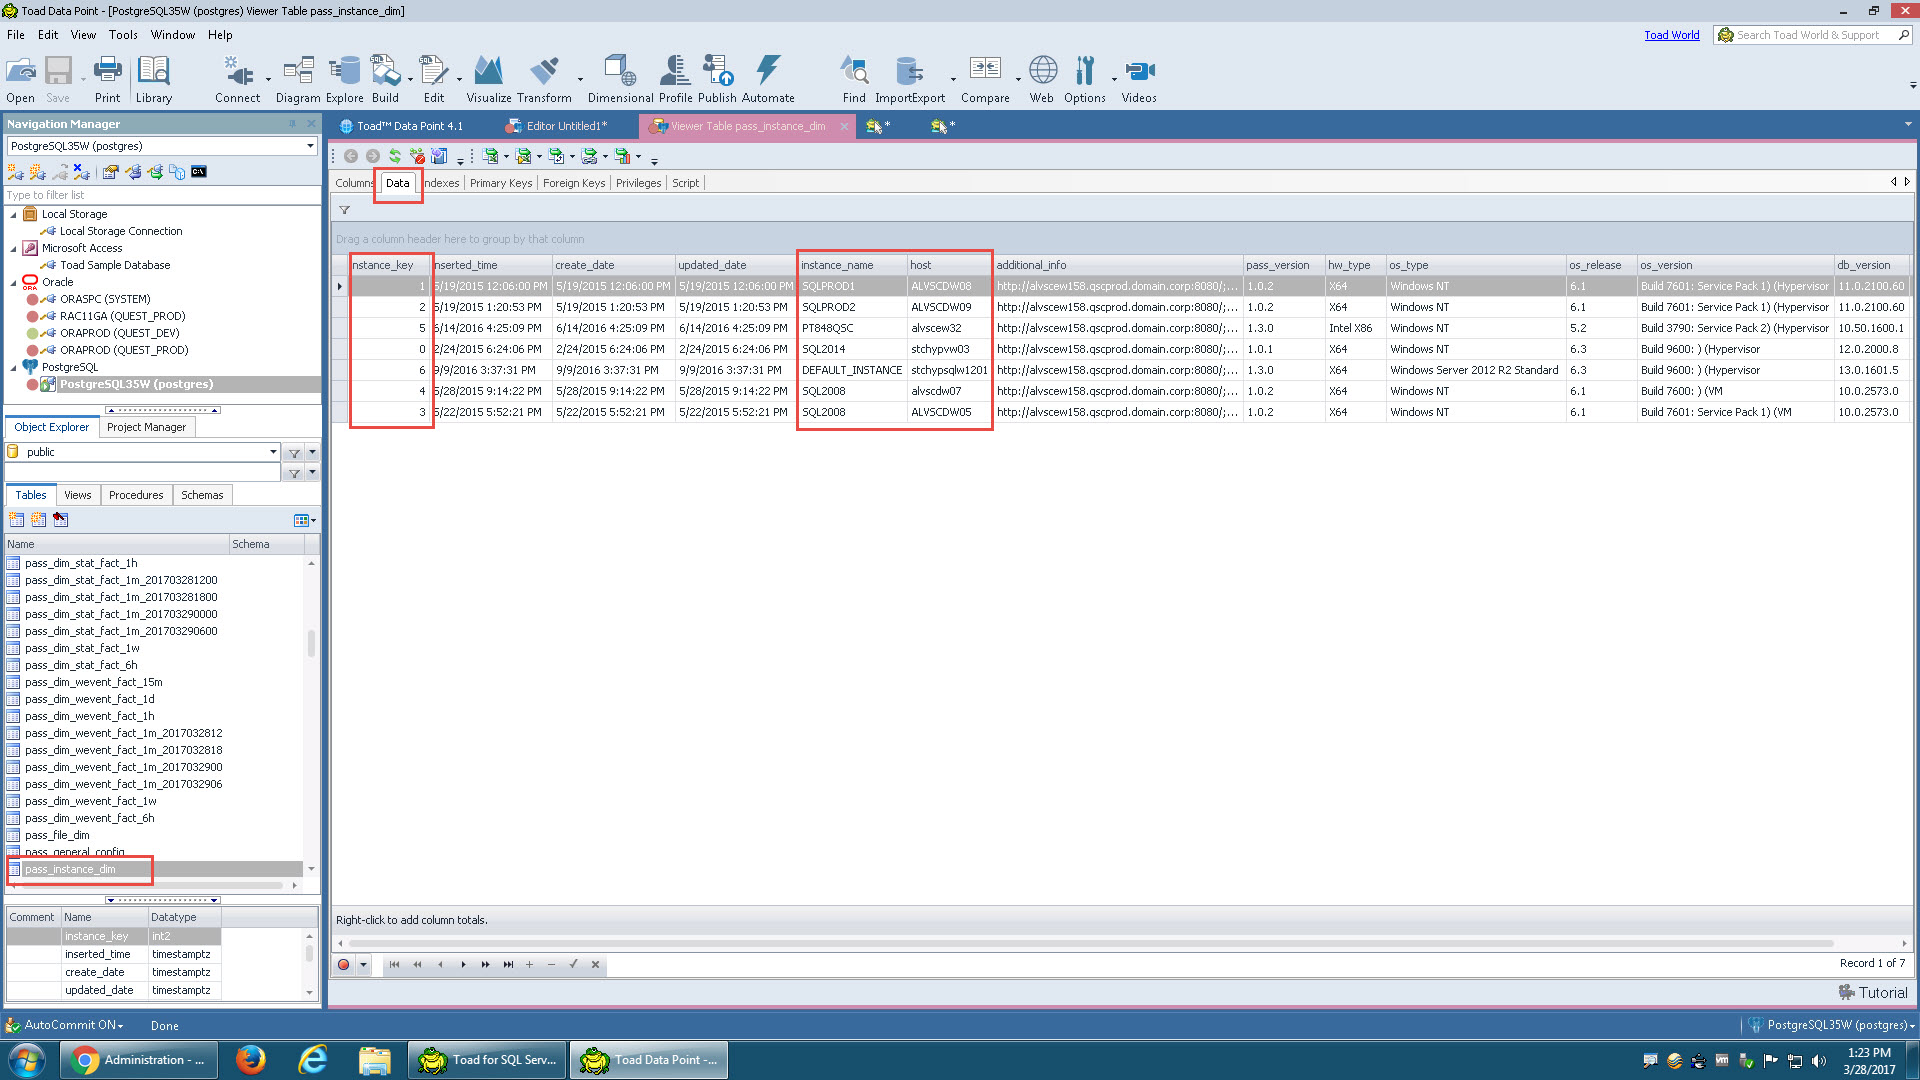
We could also use the SQL Editor and write a query. TOAD helps you along the way with table and column lookups, etc. But this query is worth saving since it gives us a quick view of our instances in Performance Investigator:
SELECT instance_key,
       HOST,
       instance_name,
       hw_type,
       os_type,
       db_version
FROM pass_instance_dim
ORDER BY instance_key
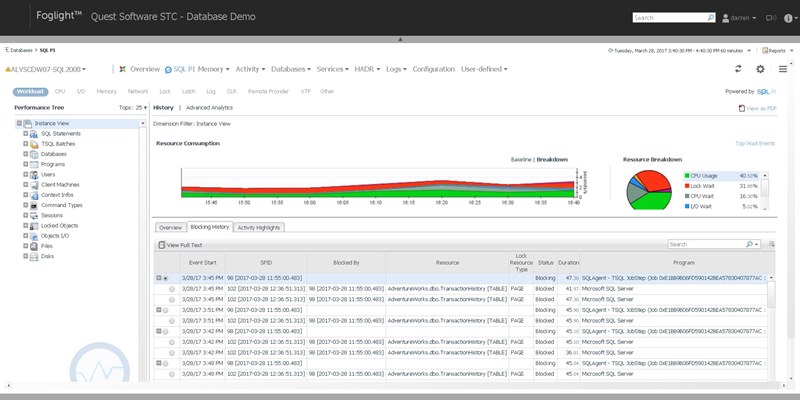
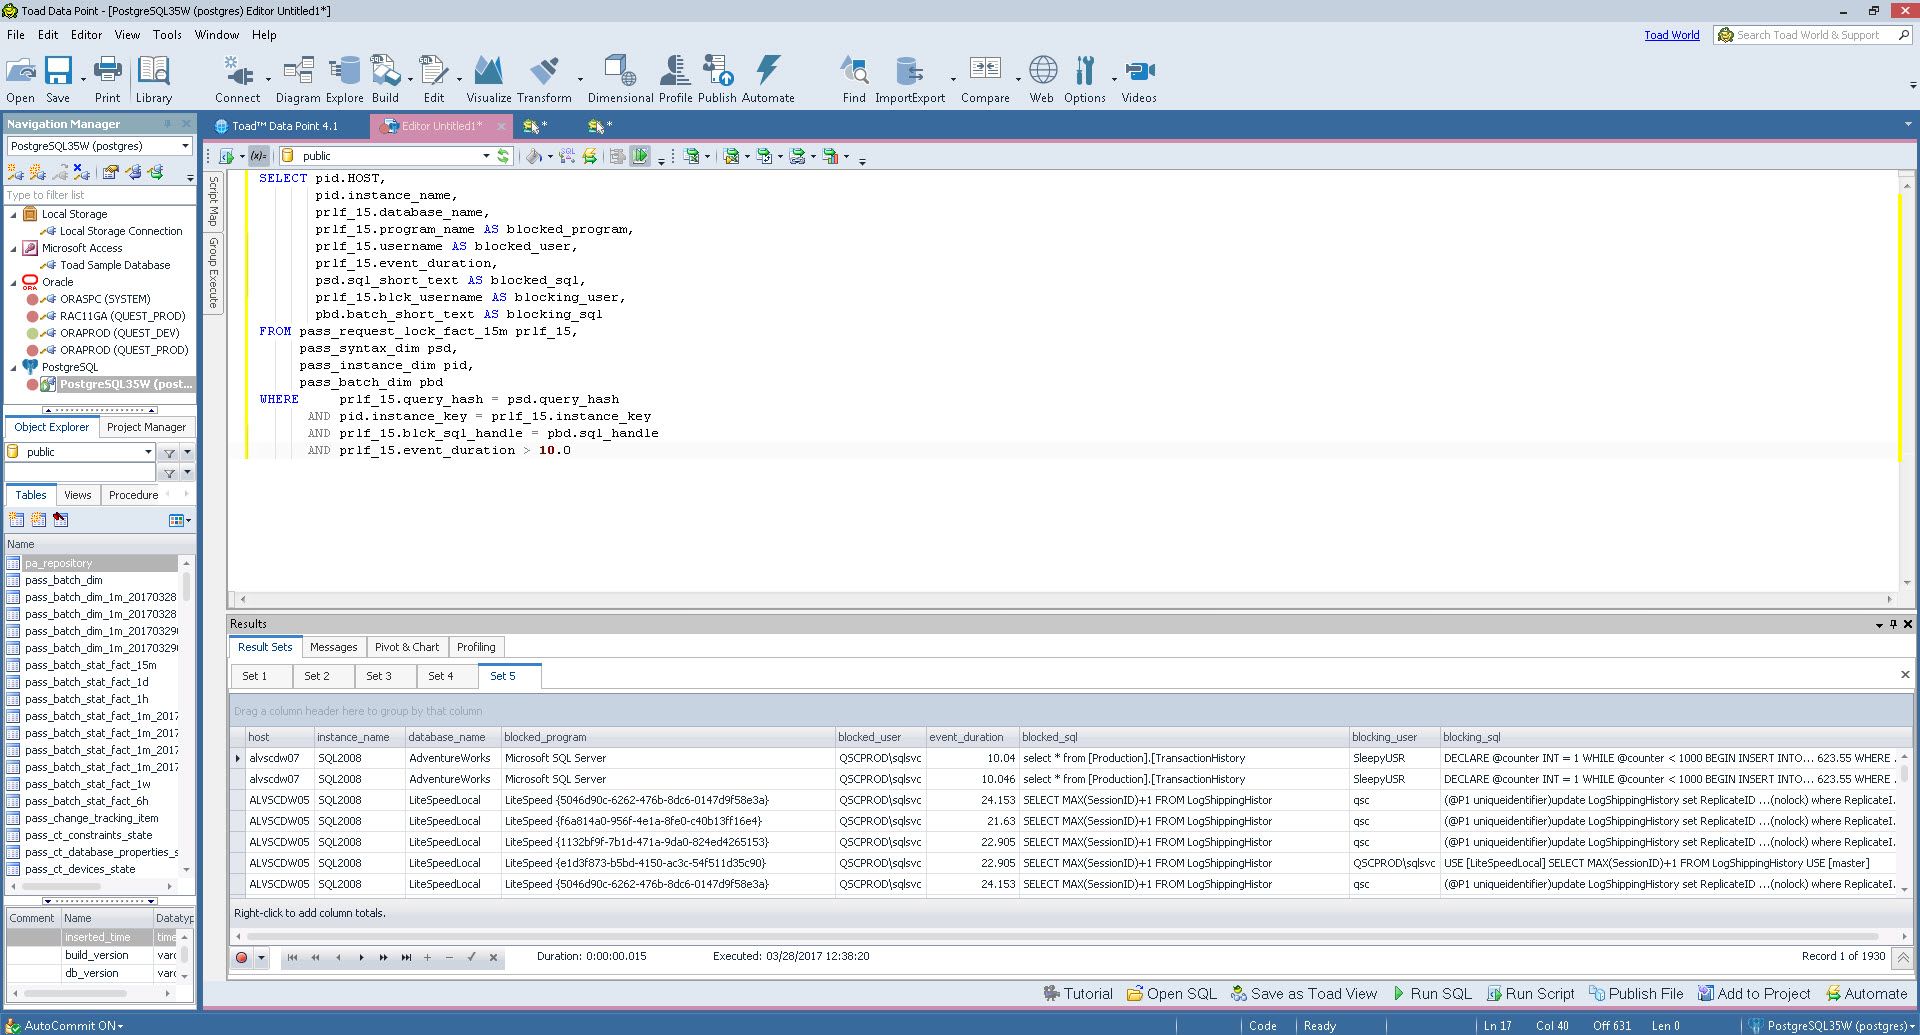
I was asked recently for help with showing blocking lock details outside of the Foglight UI. I was really good with SQL about 20 years ago, but with the help from the documentation and TOAD, I came up with the following:
SELECT pid.HOST,
       pid.instance_name,
       prlf_15.database_name,
       prlf_15.program_name AS blocked_program,
       prlf_15.username AS blocked_user,
       prlf_15.event_duration,
       psd.sql_short_text AS blocked_sql,
       prlf_15.blck_username AS blocking_user,
       pbd.batch_short_text AS blocking_sql
FROM pass_request_lock_fact_15m prlf_15,
     pass_syntax_dim psd,
     pass_instance_dim pid,
     pass_batch_dim pbd
WHERE     prlf_15.query_hash = psd.query_hash
      AND pid.instance_key = prlf_15.instance_key
      AND prlf_15.blck_sql_handle = pbd.sql_handle
      AND prlf_15.event_duration > 10.0
It shows the instance and database where queries were blocked, along with the blocked/blocking usernames and SQL text. I filtered only those blocking locks that lasted more than 10 seconds as well. If I was only after blocks on a specific instance, I could have added a where clause to include the instance_key that we had in our first example.
Let me know in the comments if there are other queries that you've written or that you're looking for.
