
The first lesson in my first computer class in school taught this: “garbage in, garbage out”. The point, of course, was that an information system can only act according to what it’s been told. It can’t read minds and assume what you meant rather than what you’ve told it. Well, maybe some can now, but that’s for another discussion. If you look at your performance monitor as an information system, you know that it needs the right inputs in order to give you the outputs you hope for.
An alarm is an output of a performance monitoring system, certainly. Foglight, like any complete performance monitor, will alert you of problems happening in your applications’ technical environments. But have you told it what a real problem looks like? You have to do that, at least for those alerts that are controlled by alarm threshold values.
Some performance monitors, Foglight among them, calculate baseline ranges (ranges of normal behavior) for many key performance indicators. Those baselines are examples of the system using the information at hand to calculate something, and your alarms based on baseline deviation will (should) be accurate. But for threshold-based alarms, it’s a different story. Again, think garbage in, garbage out for these types of alarms.
Foglight provides a lot of ways to control alarms. That’s important so you’re not misled by alarms that aren’t really about problems. Alarms, if not about problems, are chatter, fog, garbage, a waste of screen real estate - characterize them any way you prefer. Threshold-driven alarms can be controlled by setting appropriate threshold values (we call this value scoping):
- Appropriate values might change for some key performance metrics at different times of the day, different days of the week, etc.
- Or, thresholds might need to be set differently by object, like host(s), virtual machine(s), database instance(s), etc.
However you need to use scoping, this capability is essential to many organizations’ performance monitoring strategies.
Ok, so alarm thresholds can be changed for particular monitoring circumstances/objects. What is the risk there? Well, the risk is that you might not have the correct value scoping set up in your monitor. And if you don’t have the value scoping set up correctly (remember, garbage-in) your monitoring strategy falls down. Luckily, Foglight has a couple of ways to test for the currently scoped (used) threshold value for any alarm. And, for the remainder of this discussion, please keep in mind that I’m referring to threshold values that are set and scoped in Foglight registry variables. Check out this post by Quest’s Darren Mallette for an example of value scoping.
My colleague, Darren Mallette, also recently posted about how to check registry variable settings when editing a Foglight Rule. In his post, Fun with the Foglight Rule Editor, Darren describes how to use the Run Condition Query window in the Rule Editor. It’s a powerful and easy way to see exactly which value a threshold Foglight registry variable is assigned at a given time for a given monitored object.
Another tool in Foglight, the View Registry Value screen, can also help ensure that your alarms are firing based on correct thresholds.
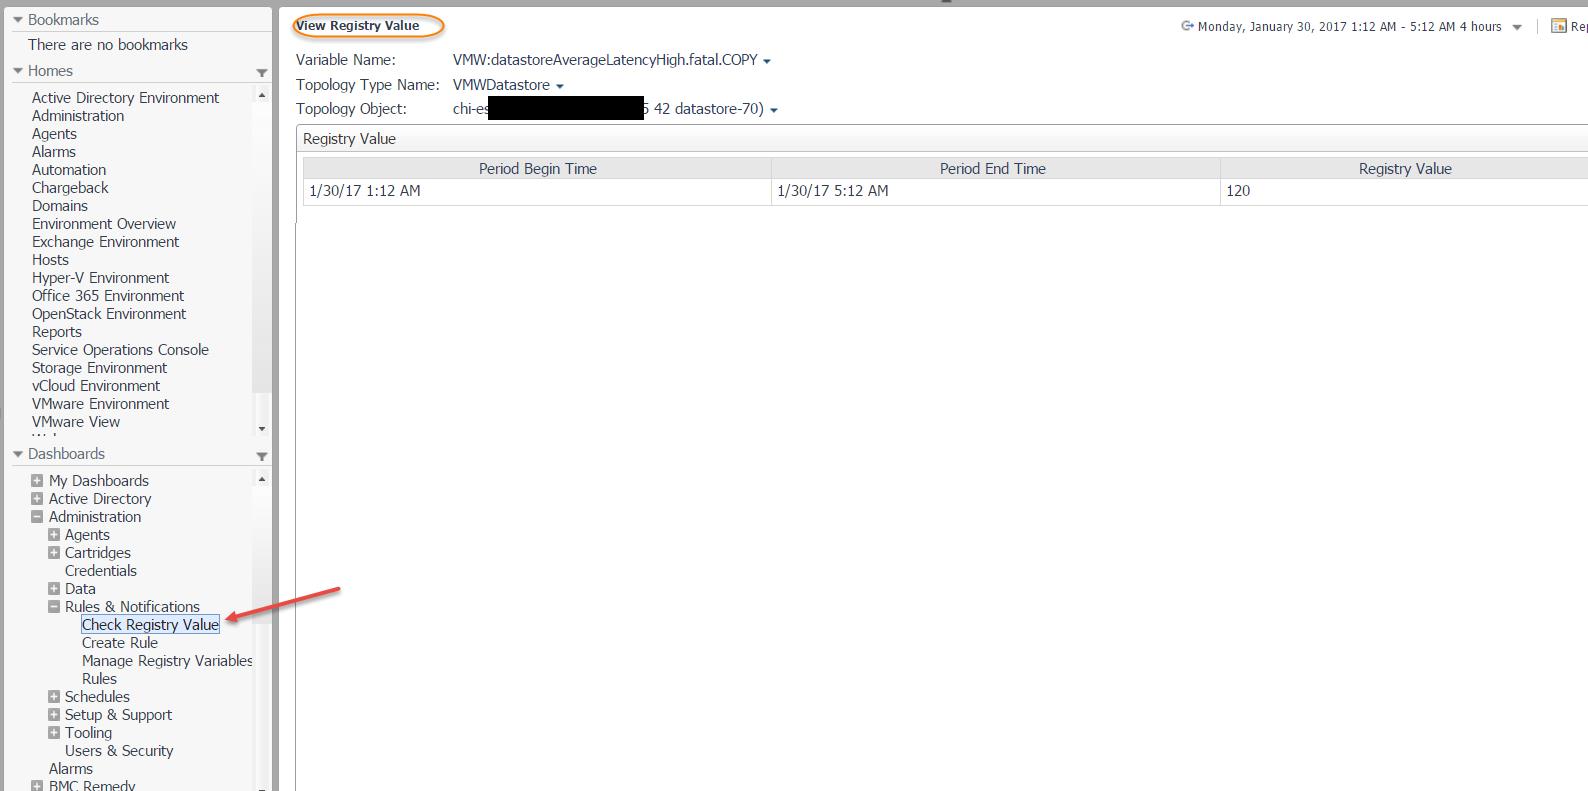
This screen is accessible from the usual ‘navigation panel’ on the left side of the Foglight Console under Dashboard—Administration—Rules & Notifications—Check Registry Value. The typical navigation takes you to the screen once you click on the dashboard. Scoping having already been set up in a registry variable can be verified using this screen anytime. The main features of this screen are:
- It allows you to choose any registry variable name that you want to investigate values for
- For the value that is scoped to a topology object you’ll be able to quickly find the topology type that object belongs to: look for the same topology type that the corresponding Foglight Rule is scoped to (since rule conditions are where these variables are ultimately used in Foglight).
- Scroll through the list of Topology Objects to find the one you want to verify the value for.
- The registry value that’s displayed can be scrutinized against the scoping that you think you have set up, the scoping that you feel gives Foglight the most accurate view of what a “problem” looks like based on a calendar schedule and/or a topology object name.
If the value you see doesn’t look right, doesn’t match what you feel the current value scoping should be assigning, you can quickly examine your scoping in the registry variable by clicking on “Manage Registry Variables” in the navigation panel, and searching for your variable name. Make a change to the scoping and then come back to this screen to check the value again.
For more information, visit our Foglight performance monitoring tool product page.
You can ask questions about the material in this post, or offer your insights and feedback, by joining us on the Foglight Community forum.
