
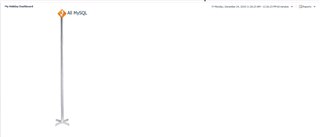
Creating your own dashboard in Foglight is as easy as putting up the Festivus pole.
In this post, a service containing all MySQL instances was created.
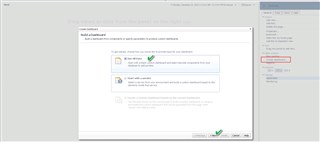
A great feature of Foglight is the ability to create your own custom dashboards and reports. Expand the right-hand panel, and select Create dashboard. I normally start with "Use All Data."
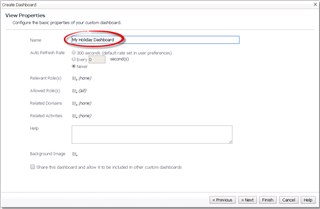
Fill out the properties for the view.
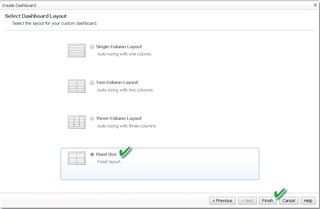
I like to use the Fixed Size layout. But you can do whatever you want!
I normally cancel the "Add View" popup, and just go right to the data browser. To get to the Services, expand the Services node and then All Services. There is a search option if you have a lot of definitions.
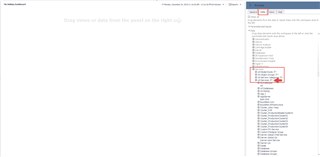
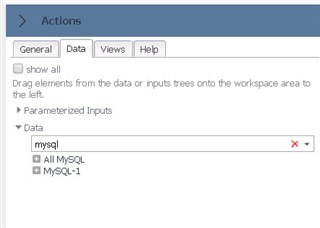
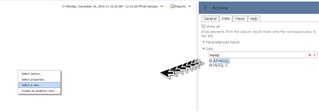
My "All MySQL" service is there so I'm just going to drag it onto the blank canvas. From there, I want to "Select a view.."
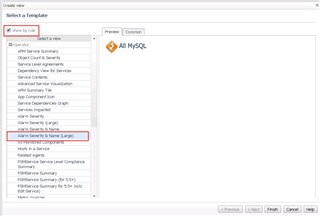
I've selected the "show by role" to make it a bit easier to see which views are available, and I really like the "Alarm Severity & Name (Large)" view. You can see a preview. Click Finish if you like it.
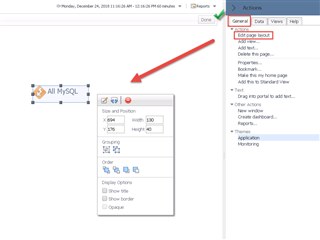
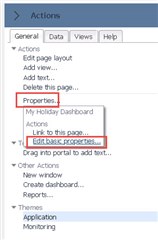
On the General tab, you can select "Edit page layout" and move the object around, resize it, etc.
We can make the dashboard more visually interesting by adding a background image. This is found under Properties -> Edit basic properties...
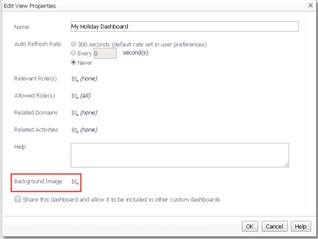
You can upload a file, select an existing one or provide a URL. Note that the image will be placed at coordinates 0,0 in the top left of the dashboard. You may need to externally edit/crop the image to get it to where you want it on the dashboard. The elements on the dashboard can be re-sized and moved to suit the image location also.
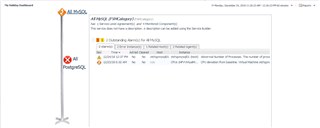
You can continue to add Services or other Foglight data to the dashboard. Views can be mixed with metrics and charts. Go nuts! The view that I picked above is nice because a hover or click will show the alarms popup automatically.
Enjoy creating custom dashboards with Foglight!
For more information, you can click here.
