
Part 2 of this series will show you how to tune the queries you found by using Workload Analysis (see Part 1). Additionally, we'll look at the different 'Context' dimensions to help you quickly focus on the right problem.
2. SQL Statements - Continued
Once you’ve identified the SQL statement or TSQL Batch that you want to tune, you can simply select the ‘Tune SQL’ option (Figure 1). The 'Tune SQL' option creates a file containing the SQL statement and instructions for the 'SQL Optimizer' to tune it. SQL Optimizer is a small add-on to Foglight which you can quickly use to rewrite the SQL statement, and/or improve your indexing. You can reference detailed information about the workings of SQL Optimizer here: SQL Optimizer - Part 1 & SQL Optimizer - Part 2.
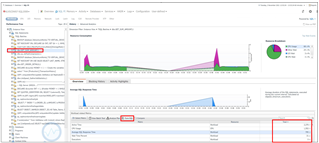
Figure 1
Figure 1 shows TSQL Batch, 'dbo.GET_SUM_AMOUNT;1' as one of the top batches spending the most time in the database. It's average SQL response time of over 13 minutes! Since there are multiple SQL statements in this batch, we need to review all the SQL statements, in order to find the most expensive one to tune (Figure 2).
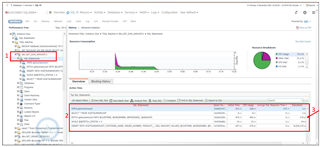
Figure 2
There are 5 statements in the 'dbo.GET_SUM_AMOUNT,1' batch. Most of the statements are executed a few times or have very little response time, however the FETCH statement is executed 175 times taking almost 3 seconds each execution. The FETCH command is retrieving rows sequentially from a 'getsumamount' cursor with is running the following SQL statement (Figure 3).
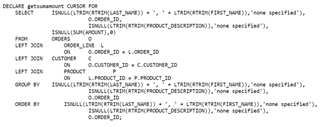
Figure 3
Let's plug this query into SQL Optimizer to see if it can tune it (Figure 4).
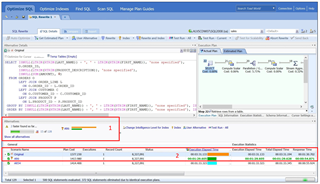
Figure 4
SQL Optimizer will try to auto optimize the query by looking at several hint options, data access methods and join access paths. It understands SQL Server's cardinality estimator and will even use trace options if appropriate. In Figure 4, you can see that the rewrite has found 2 faster SQL statements so far. It actually has put 'a little gold cup' by the fastest rewrite of 1.29 minutes where the original query took 3.31+ minutes. Also, there is a note at the bottom of the screen which shows that SQL Optimizer considered 500 SQL statements but 372 of them were eliminated due to identical execution plans. The number of SQL statements that are evaluated can be customized as well as a number of other SQL Optimizer options when using the SQL Optimizer. In addition to the rewrite, you can tell SQL Optimizer to look for better indexes or manage plan guides.
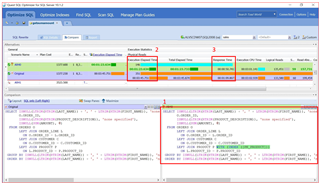
Figure 5
In the example in Figure 5, you can see that the best rewrite changed the query to include a hint of using the PK_Product index. This helped improve the elapsed time from 3.46 minutes to 1.24 minutes, response time was improved by approximately 20 seconds.
In Figure 6 below, SQL Optimizer found a second query which was faster than the original query. In this rewrite, SQL Optimizer chose to add a 2312 trace flag which tells SQL Server to use the new cardinality estimator. Using trace flag 2312 adjusts the Actual vs. Estimated number of rows statistics so the values are closer together. This will improve query performance, see Trace Flag 2312 for more information.
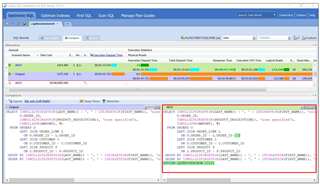
Figure 6
3. Context Dimensions
Metrics are only relative when they are put into the correct context. Traditional database management and monitoring focuses on dashboards with countless health metrics, resulting in overload and confusion.
SQL PI provides the ability to drill-down via multiple context filters to quickly provide faster analysis of the issue. For example, you can quickly find a specific a SQL statement using filters of database, user, then program, to quickly find the problematic query (Figure 7).
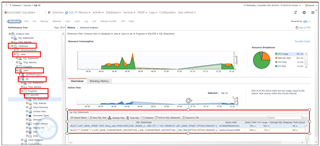
Figure 7
Depending on how the problem is presented, you can use the different context dimensions to zero in on the actual issue. For example, a user calls you and complains that the database is slow. Without knowing any other details, you may spend hours hunting for the proverbial 'needle in the haystack'! However, if you know that person works in sales, that he/she uses a specific database user, and is running a certain program - you can quickly find which queries he's running by drilling down those context dimensions. From there, you can further diagnosis the issue by using the other context dimensions such as Locked Objects, Object I/O, Files, or Disk.
This concludes Part 2 of the Multi-dimensional Performance Analysis Series where we found the 'right problem' to work on, by using the different context dimensions. More importantly, we tuned a poorly performing query using SQL Optimizer.
Next up in Part 3, we'll discuss how to utilize resource and wait types to maintain overall health and performance at the server, instance, and database levels.
