Part 3 concludes this series on Foglight and using SQL PI to quickly find, diagnose, and fixed inefficiencies in your database environments. In Part 1, we reviewed workload and poorly performing SQL statements. In Part 2, we covered the different context dimensions and how to use them to find the problem at hand. Then we discussed utilizing SQL Optimizer to tune a poorly performing query quickly. Part 3 will show how to utilize resources and wait types to maintain overall health and performance at the server, instance, and database levels.
- Resources
Database performance tuning that focuses on reducing utilization of CPU, Memory, Storage, or Network will improve the use of these resources, but this type of tuning does not necessarily translate into improved database performance. Foglight utilizes response time between an application submitting a SQL statement and the database management system responding (also know as end user wait time). This is the only metric that really matters to the applications and ultimately the end users. By starting with response time, the context of all metrics and further analysis is focused on areas that deliver the biggest impact to database performance
By correlating database response time with resource metrics, Foglight quickly shows resource contention and its effect on database and ultimately application performance (Figure 1).
Figure 1
The 2nd menu in Figure 1 shows the entire workload of the database instance (#1) and shows that the 'Delete Top...' statement is spending the most time in the database (#2). Additionally, Foglight highlights the 'Delete Top...' query in the center of the screen (#3) even though all the statements are sorted by wait time percent (#4). From here, you can choose to sort the queries by Active Time, CPU Usage, SQL Response Time, or by Number of Executions.
You can also utilize the 2nd menu to focus on specific resources if you suspect there is a bottleneck. In Figure 2, we focus on CPU intensive queries where the 'Delete Top...' query has spent well over 3 million seconds on CPU usage and wait. From here, we should try to tune this query utilizing the 'Tune SQL' option in SQL PI (which we talked about in Part 2.
Figure 2
Locking / Blocking is often a common issue in SQL Server which Foglight quickly shows when filtering on the Lock resource. In Figure 3 below, you can quickly see which query is spending the most time in a blocked situation.
Figure 3
You can view the blockers and waiters by choosing the 'Blocking History' tab in Figure 4 to see all the metrics about the block. In Foglight, you might need to kill the blocking session (SPID) in order to free up resources which you can do by choosing the blocking SPID in the Activity > Sessions menu to kill it.
Figure 4
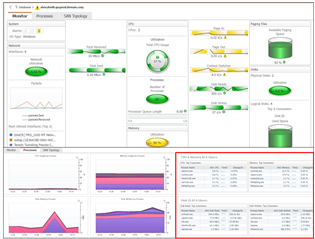
There's never been a wider array of server technology available for database deployment. On premise is being eclipsed by virtualization/VMware and at the same time cloud deployment is building momentum. Organizations are embracing a hybrid of all three deployment options and require database optimization software capable of handling all three. Foglight monitors databases on premise, virtualized and in the cloud. In addition, Foglight includes a free OS cartridge which shows network, CPU, memory, and storage utilization along with the top consumers (Figure 5).

Figure 5
- Wait Types or Wait Based Analysis
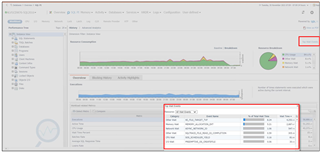
Database wait types or wait events are key to understanding the precise cause of slow SQL response time. Foglight monitors these waits and identifies those that have the biggest impact on database performance (Figure 6).

Figure 6
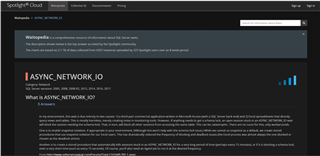
Understanding waits can be difficult, so Foglight provides a description of the wait, how to best resolve this issue, and even who within the organization typically deals with these issues. This is extremely useful for developers, IT generalists and accidental DBAs. Figure 7 shows an example of Quest’s Waitopedia which is a comprehensive resource of information about SQL Server wait types. You can also access Waitopedia directly via this link: https://app.spotlightcloud.io/waitopedia

Figure 7
Analyzing performance from the perspective of these five dimensions (workload, queries, context, resources and wait types) does not have to be difficult, provided you have the right tools. Download a free fully functional 30 day trial of Foglight today!


