This discussion has been locked.
You can no longer post new replies to this discussion. If you have a question you can start a new discussion

Core Memory

Looking to start a discussion on Core memory usage and memory trouble-shooting in general

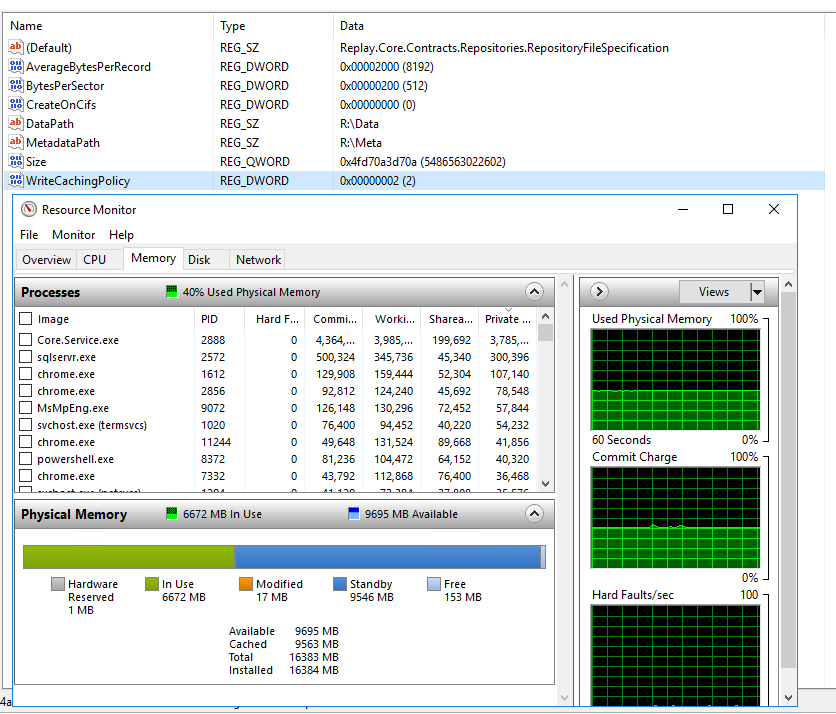
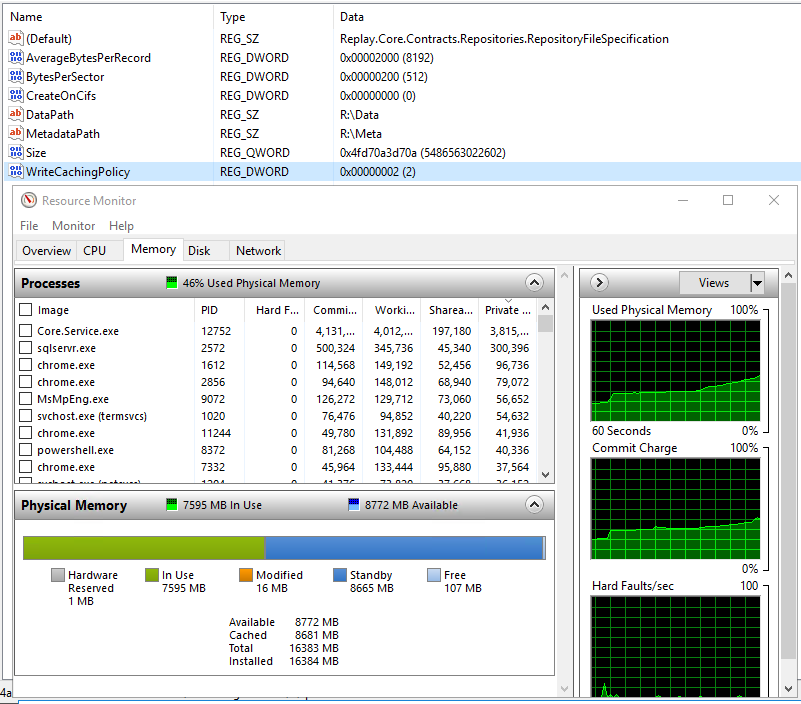
1) The first problem we are seeing is that the Core will often be at 0 free memory with a HUGE amount in standby. Yes I know low free memory is "normal" in current server OS's and that standby memory is available to be used by another application if it needs it. But that is certainly not my experience either and def not when RR is the one with all the memory in standby

I have a Core that has 125GB of memory, 25GB is in use from every process and 100GB is in standby. 0 Free

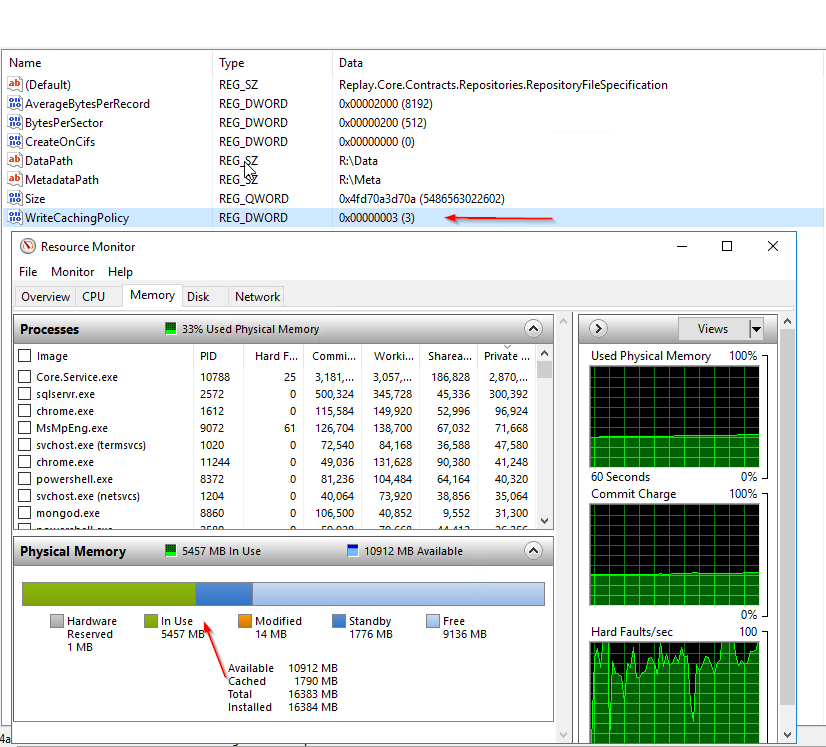
I see the TN below about write caching. But a few issues

https://support.quest.com/rapid-recovery/kb/119686/high-paged-pool-ram-utilization-on-systems-running-appassure-or-rapid-recovery

a) The Core is 2012 R2 so should not be having this issue.

b) The technote gives no indications of how to confirm if you are having this issue.

c) Without a way to confirm if I am having this issue, the technote may not even help

https://www.quest.com/community/products/rapid-recovery/f/forum/21016/core-memory-usage-in-hyper-v-vms-making-vms-unresponsive#


2) Rammap file summary will often show a HUGE amount (+100GB) of memory in standby

Is this normal, does it show a problem with write cache (or anything else)

Why does this memory only show up in RAMMAP file sumary and point to the dfs.records file of our repo.

What does it not show up as standby memory allocated to core.service.exe (or any process) in task manager/ resource monitor. This is not how process are supposed to act

  • Hi Emte:

    For those who do not already know, the standby memory is memory containing cached data that Windows used already but believes that it may be necessary again.

    Standby Memory usage is fine as long as there are a few MBs of free physical memory (at least 3 to 5MB).

    If you do constantly have no Physical memory available then it is worth investigating. In most cases it means that there is more Standby memory added than released and the issue may be tracked to some peripherals (including storage and network adapters).

    The boring but proven way to address this is updating all available firmware and drivers. Once this is done, it may make sense to launch an app known to use a lot of memory and see how the system behaves. (Try with all the standby memory in use and then released).

    If you see an identifiable difference in performance, drop me a line and I will get you a command line tool for releasing the standby memory. In the Windows 2008R2 days I was scheduling it to run periodically.

    Since it would be nice to be able to trigger the cleanup when the Standby Memory size got to some pre-determined threshold, I tried to see if I can change anything in this 2012 app. Alas, since this was many workstations ago, I lost my notes re the code in this app. As such I tried to find some info on the web and interestingly enough I found this script in the TechNet Gallery that may be helpful in setting a size related trigger.

    gallery.technet.microsoft.com/.../c-PowerShell-wrapper-6465e028

    The issue with Rapid Recovery is that due to deduplication there are relatively few blocks reused so the standby memory is largely useless.

    Anyway, in my experience, back in the day when Windows 2008R2 ruled, some applications had a hard time loading when the Standby Memory was maxed out, in may cases because it was not released fast enough to accommodate the needs of the newly launched applications. I did not see this issue in windows 2012R2 and later.
  • Thanks Tudor, I appreciate the feedback but that seems to create more questions about this issue than it answers.

    "The issue with Rapid Recovery is that due to deduplication there are relatively few blocks reused so the standby memory is largely useless. "

    A Core I am working on has 128GB of memory, 100GB is in standby and there is 0 free.

    The first issue is that 97GB of standby is taken up by the dfs-records, dfsrecords_ids file (according to file summary from rammap) So RR is the one eating up all my standby memory

    The second issue seems to be that whatever RR is doing with this 97 GB of memory is not recorded correctly. And by that I mean that no where in Task Manager or Resource Monitor can you make the correlation that the Rapid Recovery is the one who has all this memory in standby. It is only by looking at rammap that you can see this. Not a huge issue but also certainly not a best practice as far as MS is concerned

    The Core in question has some other issues with it but I have been bouncing around on a few Cores and I see the same thing on almost all of them. My local test Core is running 0 jobs and it still has 12 GB of standby memory (dfs.record's files) on a VM with only 16GB


    A follow up would be the technote

    support.quest.com/.../high-paged-pool-ram-utilization-on-systems-running-appassure-or-rapid-recovery

    Task Manager on the production Core shows 10 GB in paged pool and 9 7GB cached. My lab Core shows 400 MB in paged pool and 12 GB cached. The production Core is VERY busy and falling behind, so it is certainly possible that it is encountering the issue described but my Core looks very similar and it has not ran a singe job for hours.

    Both Cores are 2012 R2 and the paged pool memory usage is not high. So it would seem like the technote above is not a great solution. But of course it maybe that the technote was just not clearly written (it does mention cached later in the TN)

    And if it is a good solution to the production Core that is falling behind. What would you recommend I look at for my core that is doing nothing but has a similar issue?
  • Are other people seeing a huge amount of standby memory being consumed on their core from Resource Monitor but no process show's it when you sort by "Standby"?

    If you download and install Microsoft/ SysInternals RAMMAP,

    - docs.microsoft.com/.../rammap

    Click the "File Summary" tab and does it show dfs.record's has all of your memory in standby?
  • I could be way off here, but I thought that standby memory is managed by windows and the whole point of standby memory is to allow Windows to try and "cache" pages that are no longer actively needed by a process. The intent of keeping it in RAM marked as inactive rather than zero it out, is to better server the processes running on the system that are using lots of pages of RAM. So for processes that are using the same pages over and over but are deallocating memory regularly, Windows is speeding that applications data processing time by "caching" those pages so that it doesn't have to call them from the disk when the process needs them again.

    The reason the RR repository files are the ones that are making up most of the standby RAM is that when write caching is enabled on a repository, RR allows Windows to cache writes to the repository in RAM. So lots and lots of pages of RAM are consumed by writes to those files and then marked as inactive once the write is complete. Over time you see standby memory grow to consume all RAM since Windows is leaving those pages in Standby and not zeroing them out to try and improve performance. More than likely it isn't improving performance because RR is a backup software so most of what it does is data writes to the repository. Reads only happen for tasks like replication, virtual standby, data checks, rollup, etc. So unless those tasks are happening immediately after a backup completes, standby memory is probably not improving performance.

    The KB article 119686 was written specifically for Server 2008 and 2008 R2 which both had issues with quickly releasing standby RAM. Windows memory manager didn't handle standby memory as efficiently as Server 2012 and newer do, and so when the system reached 0% RAM free due to active and standby memory, we saw performance degrade. We believe it has something to do with Windows Memory manager not being able to zero a page and return it to another process efficiently. By disabling write caching, Windows doesn't fill the standby memory with cached pages from the repository writes and doesn't end up in a situation where it is completely out of free memory and has to zero out standby memory to make it available to other processes.

    That said, in 2012 and newer we have seen negligible difference between write caching enabled and disabled in the core software. Again, because RR does mostly data ingest (since it's a backup software and that's its primary purpose), it doesn't take long for Windows to run out of readily available RAM for write caching. Especially when you have 3 or 4 concurrent backup jobs sending data to the core and maxing out resources. So if you're unhappy with all your RAM being in standy, disable write caching in the repository per that KB article and I'll bet you see significantly less RAM marked as Standby.
  • Great Info and thanks for the time. My understanding of how newer OS's leave pointers in standby memory is the same as yours. But I was curious why RR was consuming this much standby memory in the first place (and I think you answered that)

    For the KB article, I think you cleared that up also but let me double check. The articles point was not about different standby memory allocation between 2008 and 2012, both will use a large amount of standby memory. But you believe 2008 had a harder time releasing this standby memory if another process requested some. So the writecachepolicy change would help stop the RR process from consuming this much standby memory on a 2008 server? Since I am not working on any 2008 Cores, is the title accurate that this will be seen as high paged pool?

    So if I have a 2012 server with high standby memory allocated (normal) and performance issues, you believe making the write cache policy change from 2 to 3 would have zero or very little effect?

    One thing I would mention, is that it seems like you should be able to quickly look at Task Manager/ Resource Monitor and find out that RR is the one using all of this standby memory.
  • That KB article is like 4+ years old and I should probably go back and review and rewrite it (although that version of the software is EOL). Yes, I believe that the issue was Windows ability to reclaim standby memory in 2008. So since we can't improve Windows, we avoid the situation by removing write caching which absolutely is responsible for large quantities of standby memory. I don't remember if it showed up as high page pooled. I'm pretty sure it didn't, but frankly, without installing the old build and testing it out, I can't tell you for sure one way or another.

    I'm not saying that disabling write caching is not worth trying. If you have a server with performance issues and high standby memory, I'd absolutely try disabling write caching. We have seen it help on 2012 servers in some situations. We still haven't isolated exactly why it helps, but usually it helps on core servers with lots of agents and lots of jobs occurring. I personally believe it has to correlate with Windows write caching not being able to keep up and swap the memory as fast as it should and if you simply force Windows to pass the write over to the storage immediately you usually get the benefit of controller or disk caching on the storage and that is faster than Windows for sure. Essentially you remove a layer of data processing by removing the write caching option and that can speed things up. On systems where you don't have controller or disk caching (like a CIFS repo) you might see improvement in speeds when write caching is enabled vs. when it is disabled. But like I said, that's a hunch straight from my gut and not necessarily based on any specific testing I've seen done.

    I agree, it would be nice if Windows showed with what files the pages in standby RAM coincide.
  • Awesome. Thanks again. On a related note, how do you track performance on a busy Core (or any core) This is one thing I always struggle with, checking the rate of a single job seems time consuming and unreliable.

    Is there any numbers you can get from the logs (or anywhere) that can give me more insight?
  • Hi Emte:

    If I understand correctly, there seems to be some misunderstanding (how's that as a lame pun) between the way Rapid Recovery manages cached memory and standby memory. There some connection between the two but it is on the Windows side and daresay,  it even makes some sense.

    To clarify, I suggest an experiment.

    Open the Resource monitor and set it on the memory tab.

    Open Regedit and make sure that the WriteCaching Policy is set to 2. Take a snapshot or a small base image to get the Standby Memory running. When all is done, you get something like below:

     Once no jobs are

    When no jobs are running, restart the core service. When the core service comes back and all the related tasks finish, you get something like below:

    Please note that during the service restart process, the Standby memory changed very little if at all. The main memory variations were related to the used memory (green) which changed quite a bit, first being released, then being re-allocated at the time the service finished restarting and after that by Windows memory caching allocations.

    Now, change the WriteCachingPolicy to 3 and restart the core service without touching anything else.

    You get something like this:

    If you monitor the operation you will see that the standby memory remains constant until the core service finishes all service restart related jobs. (Reason for the hard faults as well)

    The total memory used by Rapid Recovery has decreased due to caching being not managed by Windows. At the same time a significant part of the Standby memory (which was not touched) was suddenly released (I guess at the time Windows 'notices' that it does not managing the Rapid Recovery Cache Policy anymore).

    The explanation is that Memory that was cached by Windows before being flushed into the repository continued to be kept 'at hand' as standby memory. Once Windows caching is not used anymore, the need for that standby memory goes away and as such it is released.

    However, over time, other I/O operations may increase the standby memory usage.

    Again, the Standby Memory per se is a positive Windows feature as long as it is properly released when needed -- a process that was significantly improved in Windows 2012R2 and 2016.

    However, as stated before, the Standby Memory, which was designed for small files manipulations, does not help deduplicated backups too much -- there are too few reusable blocks hosted in the Standby Memory to have a significant performance impact (but it does not do any harm either).  

  • I think I understand the situation now thanks to all the information presented. And while you guys have cleared up a lot of information about writecachepolicy and the TN. I have not really made any progress on my goal.

    How would I know if writecachepolicy SHOULD be changed? It is normal for the Core to have most of the standby memory with writecachepolicy = 2, so that is not a good indication. Do we just change the writecachepolicy on any server that we think is slow, do we watch perfmon disk queue length?

    I have made the changes to writecachepolicy on this core, but how do I track performance? How do I know if this change (or any change) has helped? Lets assume that disk queue length was the piece to monitor, and lets assume that dropped. That does not mean that RR is any faster.

    So how would you recommend I track performance on the Core?
  • i just wanted to let you all know that I had the same experience Emte did. Multiple cores with 256GB of ram and RR was eating all of it. Except for most of my repositories I was not able to change write cache policy from 2 to 3 because the rep would no longer mount. Eventually I was able to create new reps with write caching set to off, aka 3 and it made a huge difference. My memory usage went from 95%+ to 60% max and my I/O speeds doubled, almost tripled.

    My experience does not match what you guys are saying about 2012. Maybe it is better at working with RR, but it still sucks. I would maybe go as far as recommending this change for anyone having this issue with 2012 as well, at the very least stop saying it's 2008 only because that's not true! I'm only adamant about this because I would of made this change a long while ago but I overlooked it because of the 2008 statement. 

    Anyways it doesn't seem to be necessarily related to the protected machine number on the core, but could still be a factor. 3 2012 cores had this issue, 1 with 100+ machines, 1 with 50ish, and 1 with about 15. Although the core with 15 was always able to achieve better performance than the others, but still constantly has 0 free space. They are all 60+ TB cores so I think that could be a factor but I don't know. Also limiting the number of jobs that can run seems to help, I have mine set to 5 right now, which is lower then I would like but it keeps my free memory fluctuating from 0 - 25MB, which I believe to be ideal.

    I've changed 2 of the 3 cores to 3 with success but I'm stuck on the last one. It's the smallest machine wise but the largest size wise, at 130TB I do not have the space to recreate this and retain our retention policy. The BytesperSector in registry shows as 512 for every storage location but when I change it to 3 the rep fails to mount. I would like to turn of windows write caching for this core as well and let RR do it. Any idea's on how I can deal with this?