

Note: Database Expansion Pack download was updated in 2022
Hello all. I am pleased to provide the latest release of my Foglight Database Expansion Pack for general use. Any customer (current or future) is encouraged to install this pack into their Foglight deployment in order to take advantage of the dashboard and reports it provides. If anyone has any comments, questions, concerns, or ideas for future dashboards, please post below!
Current version: 7.2.0
THIS VERSION REQUIRES FOGLIGHT MANAGEMENT SERVER 5.9.3 OR HIGHER. IF YOU ARE RUNNING A PRIOR VERSION OF THE FOGLIGHT MANAGEMENT SERVER, PLEASE DOWNLOAD THE OLDER VERSION BELOW:
<CLICK FILE BELOW TO DOWNLOAD VERSION 7.2.0 for FOGLIGHT MANAGEMENT SERVER 6.0.0 AND UP>
Database_Expansion_Pack-7_2_0.zip
<CLICK FILE BELOW TO DOWNLOAD VERSION 5.4.5 for FOGLIGHT MANAGEMENT SERVERS PRIOR TO 5.9.3>
2627.Database_Expansion_Pack-5_4_5.zip
Attached you will find the current release of my "Database Expansion Pack". The goal of this custom cartridge, is to showcase the wide range of possibilies that Foglight's custom tooling can provide our customers. I hope that the dashboards and reports included in this pack, will serve as added motivation for all of our customers to extend upon Foglight's out of the box capabilities, and make the solution their own.
This pack should be considered beta. I have tested it's functionality to the extent that I am able, and therefore cannot make any guarantee's that there will not be issues. As issues are reported I will do by best to address them.
Currently included in the pack are the following dashboards/reports/rules:
Custom Dashboards and Reports
- DB Expansion Pack
- Analytics
- Database Heatmap: Across all monitored instances, displays an alarm oriented heatmap. Servers will be color coded and sized based on alarm severity and count.
- Cross Platform
- Dashboards
- Enterprise Disk Space Summary: Across all monitored operating systems, displays disk space usage.
- Dashboards
- Oracle
- Dashboards
- CPU Summary: For a particular Oracle Instance, displays CPU relevant metrics.
- Enterprise Execution Rate Summary: For all monitored Oracle instances, displays execution rate statistics.
- Enterprise Instance Availability Summary: For all monitored Oracle instances, displays avaiability metrics.
- Enterprise Oracle Performance Summary: For all monitored Oracle instancesm displays high level performance metrics.
- Instance Execution Rate Summary: For a particular Oracle instance, displays trended execution rate metrics.
- Memory Summary: For a particular Oracle instance, displays trended Memory metrics.
- Network Summary: For a particular Oracle instance, displays trended Network metrics.
- Tablespace Growth Summary: For a particular Oracle instnace, displays trended tablespace growth.
- Dashboards
- Analytics
-
-
- Reports
- Enterprise Instance Availability Report: For all monitored Oracle instances, reports on instance availability.
- Enterprise Oracle Execution Rate Report: For all monitored Oracle instances, reports on execution rate statistics.
- Enterprise Oracle Performance Summary Report: For all monitored Oracle instances, reports on high level performance metrics.
- Tablespace Growth Report: For a particular Oracle instance, reports on tablespace growth.
- Reports
-
-
- SQL Server
- Dashboards
- Capacity Planning: For a particular SQL Server Instance, displays database growth and future storage projections.
- CPU Summary: For a particular SQL Server Instance, displays CPU relevant performance metrics trended over a user defined time range.
- Database Backups: For a particular SQL Server instance, displays all SQL Server databases, and how long it has been since a backup has occurred.
- Database Transaction Rate Summary: For a particular SQL Server instance, summarizes transaction rate metrics. Batches/sec per database, and query volume metrics are included.
- Enterprise Capacity Planning Summary: For all SQL Server instances, displays aggregated storage metrics, along with future storage projections.
- Enterprise Instance Availability Summary: For all SQL Server instances, displays instance and OS availability. Updated to show real time and historical availability for all instances, along with color coding to highlight instances with availability problems.
- Enterprise Filtered Availability Summary: Similar to dashboard above, however only shows servers that have experienced availability issues.
- Enterprise SQL and Windows Host Comparison Summary: For all SQL Server instances, displays SQL and Host CPU/Memory Statistics.
- Enterprise SQL Database Files Summary: For all SQL Server Instances, displays all data and log files along with storage (space used, allocated, and autogrow settings), and performance (virtual file stats) metrics. Searching and filtering allows for quick access to specific databases/files.
- Enterprise SQL Server Always On Summary: Displays all SQL Server Always On Availability Groups in an environment, along with where each replica sits, and what each replica's role is, along with alarm and latency metrics.
- Enterprise SQL Server Backup Summary: For all SQL Server instances, displays last backup time (recovery point) for each database.
- Enterprise SQL Server Config Summary: For all SQL Server instances, displays sp_configure settings. Searching, sorting, and filtering can be used to isolate specific servers and configures. Useful in comparing configuration settings across servers.
- Enterprise SQL Server Job Summary: For all SQL Server instances, displays job statistics with searching and filtering capabilities.
- Enterprise SQL Server Performance Summary: For all SQL Server instances, displays high level performance stats.
- Enterprise SQL Server Resource Utilization Dashboard: For all SQL Server instances, displays CPU utilization, Memory Page Life Expectancy, Disk Latency, and Storage consumption. Servers are color coded by those that are over (red) or under (green) utilized. Also included are a list of all SQL Server databases across all instances, with transactions per second metrics.
- Enterprise Transaction Rate Summary: For all SQL Server isntances, displays transaction rate statistics.
- IO Summary: For a particular SQL Server Instance, displays IO rate statistics, broken down by disk device and process.
- Memory Summary: For a particular SQL Server Instance, displays memory specific metrics.
- Network Summary: For a particular SQL Server Instance, displays network specific metrics.
- Reports
- Capacity Planning Report: For a particular SQL Server Instance, displays database growth and future storage projections.
- Database File Growth Report: For a particular SQL Server Instance, displays data and log file growth.
- Database Transaction Rate Report: For a particular SQL Server instance, summarizes transaction rate metrics. Batches/sec
- Enterprise Availability Summary Report: For all SQL Server Instances, displays instance and OS availability.
- Enterprise Capacity Planning Report: For all SQL Server instances, displays aggregated storage metrics, along with future storage projections.
- Enterprise SQL Database Files Report: For all SQL Server Instances, displays all data and log files along with storage (space used, allocated, and autogrow settings), and performance (virtual file stats) metrics.
- Enterprise SQL Server Backup Summary Report: For all SQL Server instances, displays last backup time (recovery point) for each database.
- <NEW>Enterprise SQL Server Missing Backups Report: For all SQL Server instances, displays databases that have gone more than N (default of 3) days since a backup occured.
- Since this report requires a parameter, it will not show up in the navigation menu of Foglight. Run the report with the "Run a Report" wizard, select "Templates by Module", and navigate to the DB Expansion Pack section.
- Enterprise SQL Server Job Summary Report: For all SQL Server instances, displays job statistics.
- SQL Server and Windows Host Resource Comparison Report: For all SQL Server instances, displays SQL and Host CPU/Memory Statistics.
- SQL Server Resource Usage Report: For a particular SQL Server instance, displays performance metrics trended over time.
- Dashboards
- SQL Server
Custom Rules
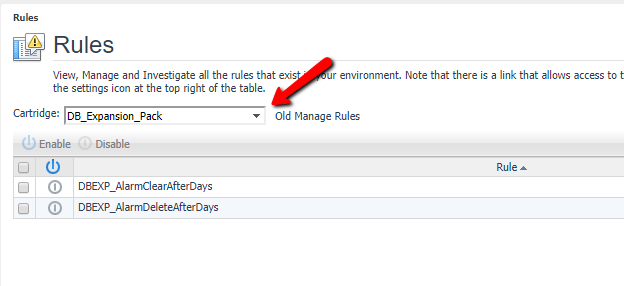
This latest release of the Expansion Pack also includes two custom rules designed to help Foglight admins clear and purge old alarms they may no longer care about. These alarms are disabled by default, but can be enabled via the Administration -> Rules & Notifications -> Rules interface, selecting the alarms, and clicking the enable button:
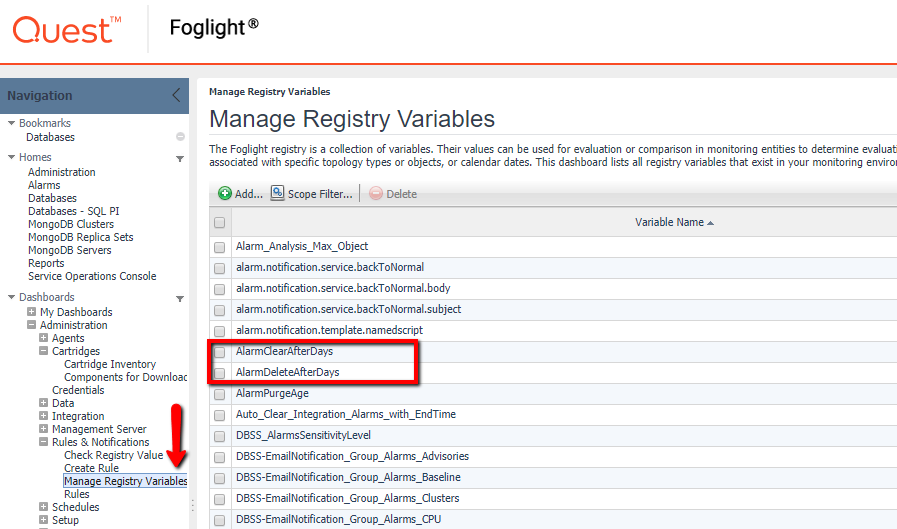
These alarms reference two registry variables (AlarmClearAfterDays and AlarmDeleteAfterDays). These registry variables define after how many days alarms will be cleared, and also deleted. The default behavior is that alarms will be cleared after 3 days, and deleted after 30 days, however these variables can be customized however you wish. The screenshot below shows where these registry variables can be customized in the Administration -> Rules & Notifications -> Manage Registry Variables interface:
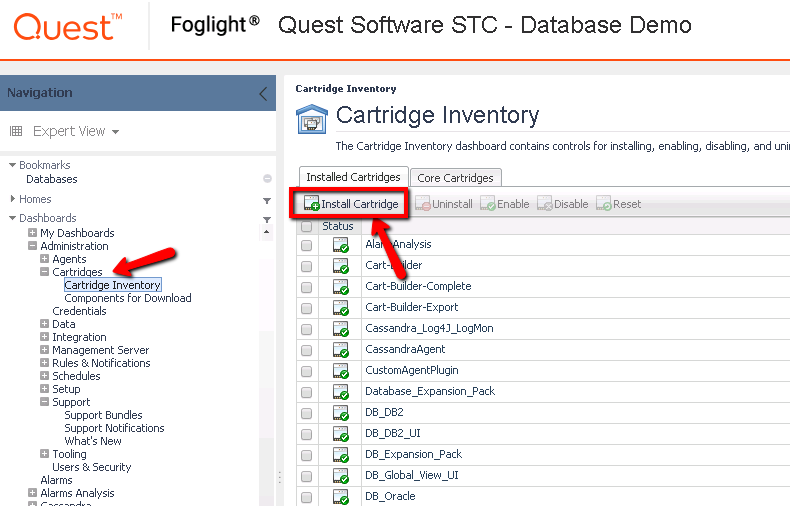
To Install the Database Expansion Pack Cartridge
In the Administration -> Cartridges -> Cartridge Inventory dashboard, press the "Install Cartridge" button. Point to the downloaded cartridge file, and click the "Install Cartridge" button. Once loaded, you should see the "DB Expansion Pack" module in the left hand navigation tray (you may need to refresh the browser for it to show up). You can expand this module and select the dashboards or reports to view.
I'm interested in any and all feedback!

