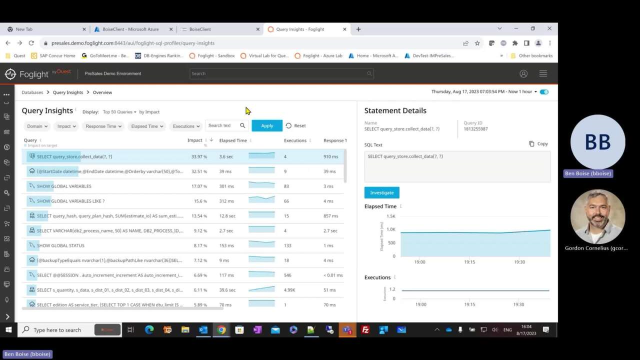
Foglight Query Insights with Easy Buttons
 06:23
06:23
Related videos
The Hidden Costs of Overlooking Database Performance
There is a crucial connection between database performance and the success of your services and transactions. While APM can inform you of general performance is...
01:27
Enterprise Management and Observability
Enterprise Management and Observability
33:33
Developers Using Operations Class Tools for Testing Performance
In this short video, we highlight the benefit of developers using Foglight to test the performance of a query before it hits production. We crossed over into a ...
23:23
Cloud Database Native Monitoring - What You Don't Get
Cloud Database Native Monitoring - What You Don't Get
18:48
Specialized Database Observability: Is it THAT Important?
The speed at which an application processes data can make or break the user experience. While APM tools offer a broad view of system performance, they often lac...
02:52
TransUnion improves database performance monitoring with Foglight
TransUnion shares how Foglight helps to maintain high levels of uptime and performance for their applications that manage 1 billion consumer files.
06:48
Viewing the Health of Your Instances
This video shows several different ways Foglight helps monitor database health. Pre-built alarms show the severity of issues across the entire environment and a...
04:49
The Foglight Difference – Advanced Database Performance
What makes Foglight different from other monitoring solutions? This time-sensitive solution provides organizations with advanced analytics, activity highlights,...
08:27
Monitor all your databases from a single, intuitive console
Proactively ensure peak performance across all your databases.
29:59
Introduction to Rules and Alarms
Foglight tracks system metrics and constantly evaluates those metrics against rules. If conditions are matched, an alarm is fired. This video gives an overview ...
04:48
How TransUnion uses Foglight to monitor their databases
Anthony Stephens of TransUnion explains how they use Foglight and Foglight Performance Investigator to diagnose and resolve database performance issues.
01:47
How to setup email server settings in Foglight
Learn how to setup email server settings in Foglight, the solution from Quest that helps monitor, manage and resolve performance issues across your infrastructu...
02:29
How to Monitor SQL Server Analysis Services (SSAS)
SQL Server Analysis Services (SSAS) is an online analytical processing and data mining tool that many organizations use for business intelligence. You can creat...
05:42
Foglight vs. Third Party Database Monitoring
Foglight empowers DBAs across your organization to deep dive into platforms both that they’re familiar with, as well as those they’re not so familiar with. With...
04:43
Foglight vs. Enterprise-Wide Monitoring
Foglight goes beyond enterprise-wide monitoring with its breadth of coverage and granular reporting of workload and performance. Gain a deeper understanding of ...
04:52
