SQL Server execution plans are a gateway for query optimizer and query executions for database professionals. They reveal query processing and involved phases such as affected tables, indexes, statistics, types of joins, the number of affected rows, query processing, data sort and data retrieval.
In a past article, SQL Server Execution Plan — What is it and How Does it Help with Performance Problems? we explored the high-level query execution workflow, the different types of execution plans (graphical, XML and text), along with actual and estimated execution plans.
Now, we’ll explore things you need to know when evaluating SQL Server execution plans and how to best interpret the information.
Reading a graphical SQL Server execution plan
Generally, we read execution plans from right to left. You begin with the top right-most execution plan operator and move towards the left. It helps you follow the logical data flow in the query.
Suppose you execute the following query in an [AdventureWorks2019] sample database and view the actual execution plan.
SELECT TOP (10) [SalesOrderID][SalesOrderDetailID][CarrierTrackingNumber][OrderQty][ProductID][SpecialOfferID][ModifiedDate]FROM [AdventureWorks2019].[Sales].[SalesOrderDetail] where [UnitPrice]>1000
The query retrieves data from the [Sales].[SalesOrderDetail] table for orders with a unit price greater than 1,000.
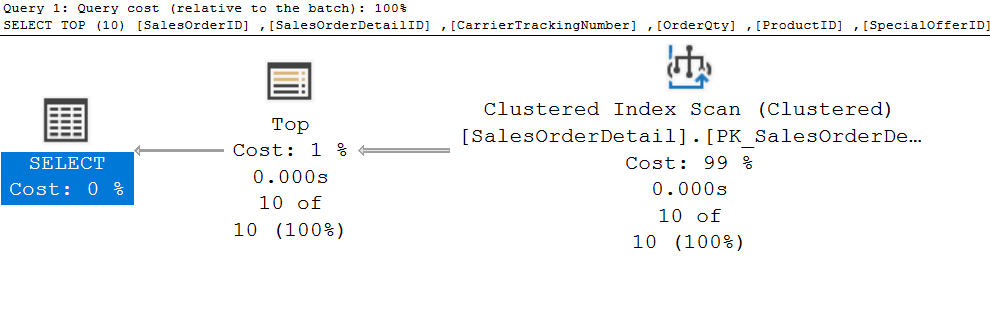
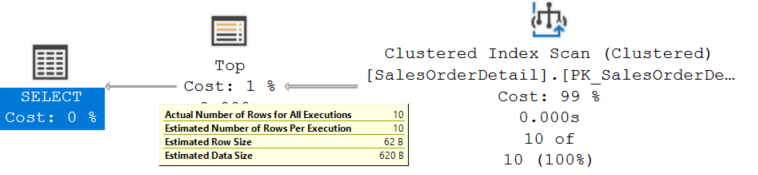
If we read the execution plan from right to left, we’ll note the following:
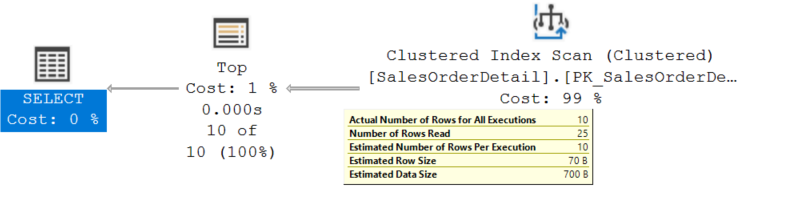
- The first operator is the Clustered Index Scan that reads data from the [Sales].[SalesOrderDetail] table. When you take your mouse pointer to the arrow connecting the Clustered Index Scan and Top operator, it returns the estimated and actual number of rows, and estimated data size.
- It passes data from the Clustered Index Scan operator to the Top operator passes the 10 rows to the SELECT operator.
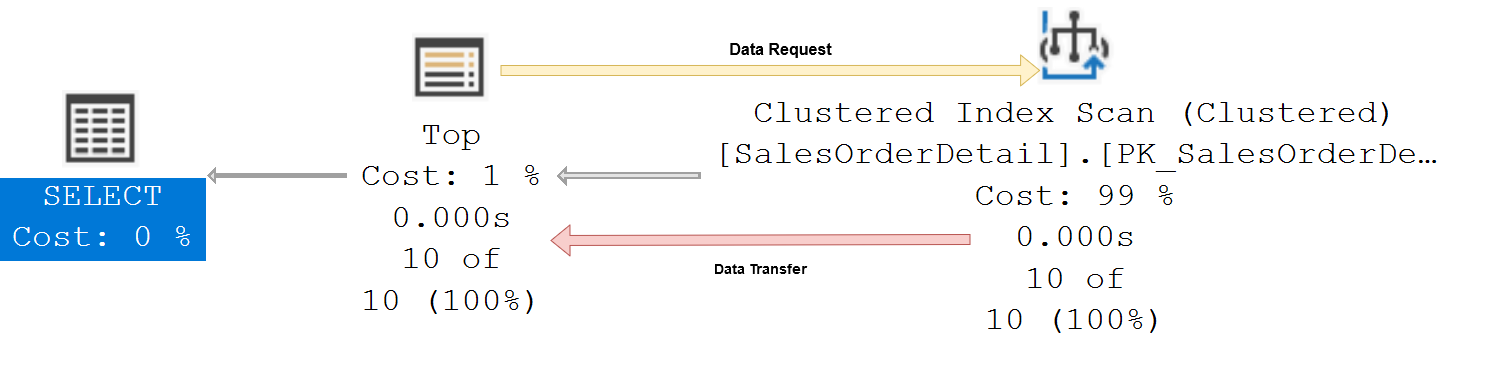
Internally, SQL Server executes the plan from left to right. If you are interested in operator’s physical orders, you should read an execution plan from left to right. Each operator requests data from the next operator. For example, in the above scenario, the Top operator requests data from the Clustered Index Scan. The Clustered Index Scan returns the rows from the [Sales].[SalesOrderDetail] table that satisfies the Where clause condition.
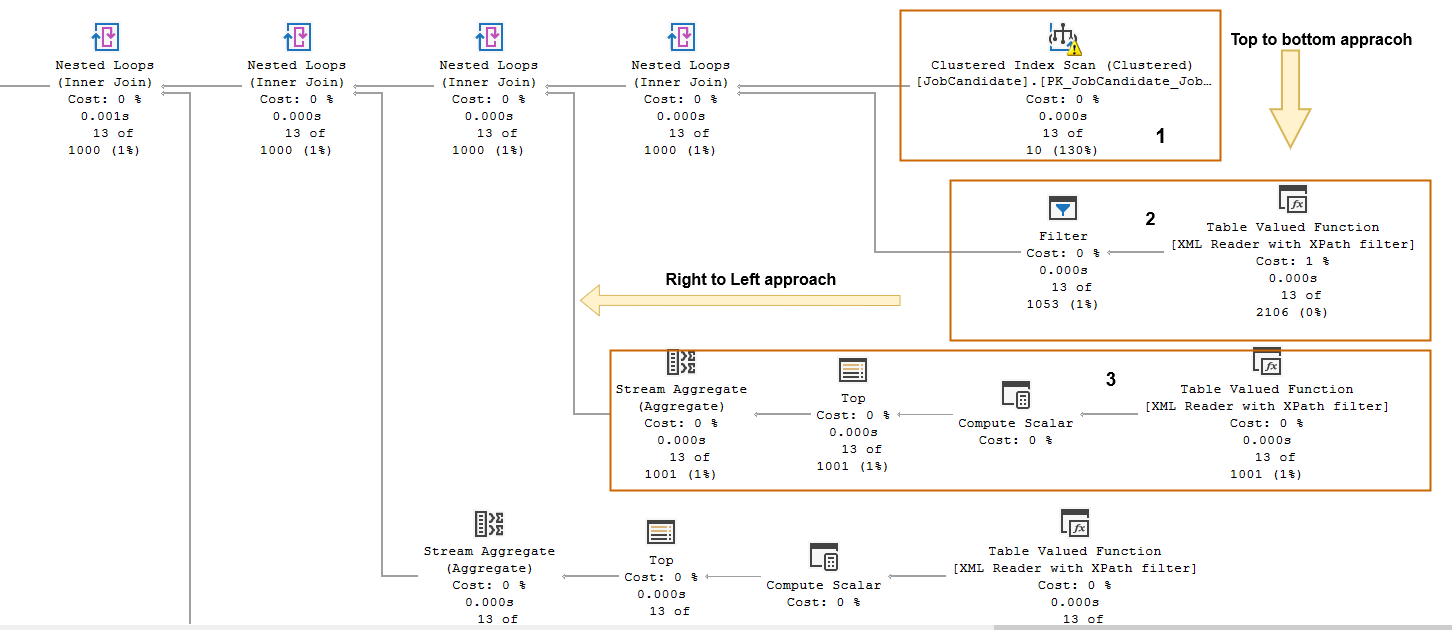
In the event that multiple branches merge in an execution plan, you should follow the right to left, top to bottom approach.
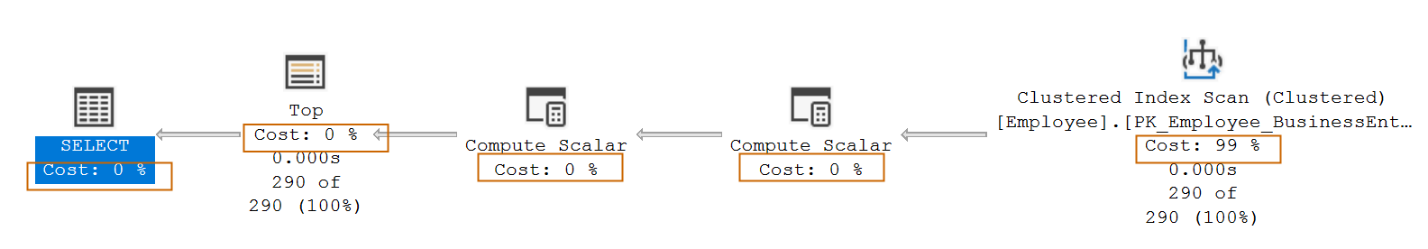
Operator costs
Each operator in a SQL Server execution plan is associated with a cost. The operator cost is relative to other costs in the execution plan. Usually, we need to concentrate on the costly operator and tuning the query around it.
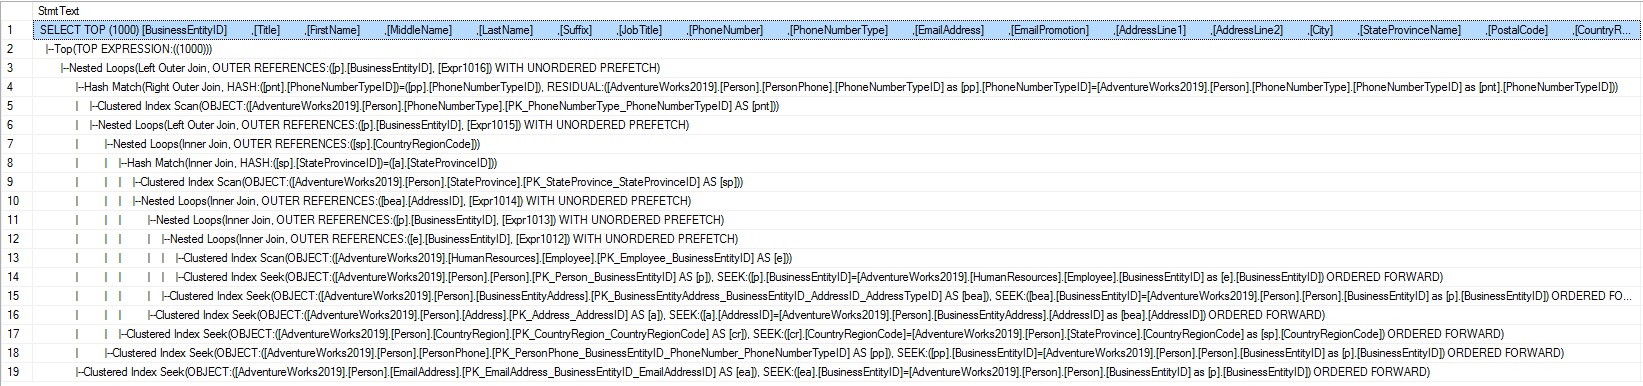
In the event of a complicated execution plan, it might be challenging to identify the costly operator. In this case, you can use SET SHOWPLAN_ALL ON, and it will provide information in a tabular format.
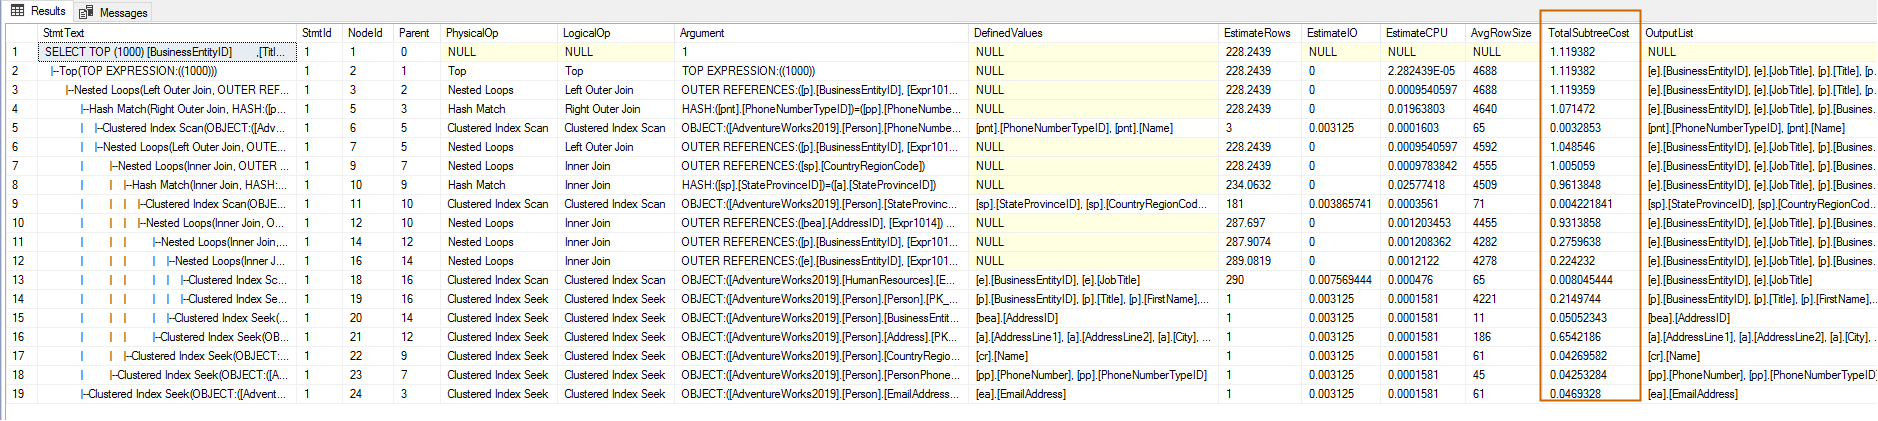
You can also use the [Stmt text] to break down the execution plan at each operator and statement level.
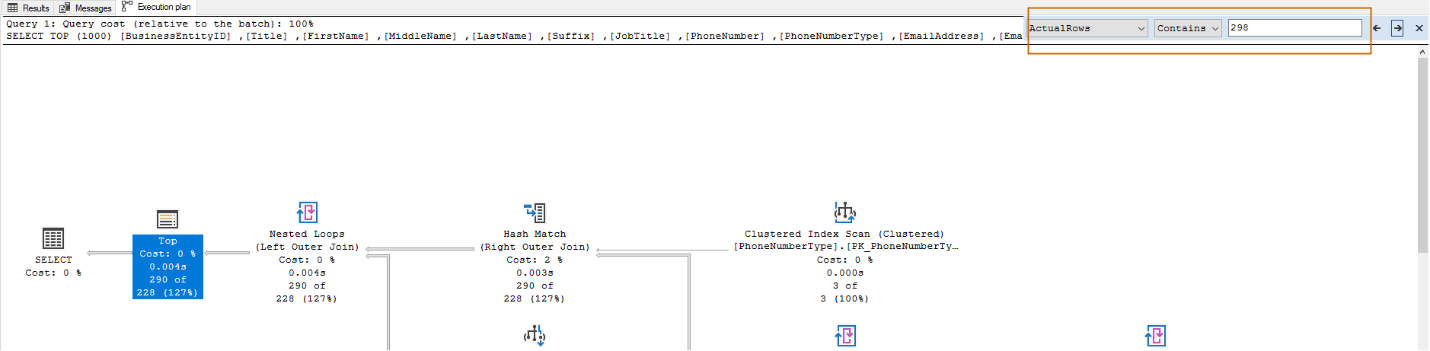
SQL Server Management Studio (SSMS) also gives the flexibility to find an operator based on search criteria. To do this, right-click on the execution plan and select Find Node. This will open a window with various search conditions. Specify your requirement, and it will point to the particular node, as shown below.
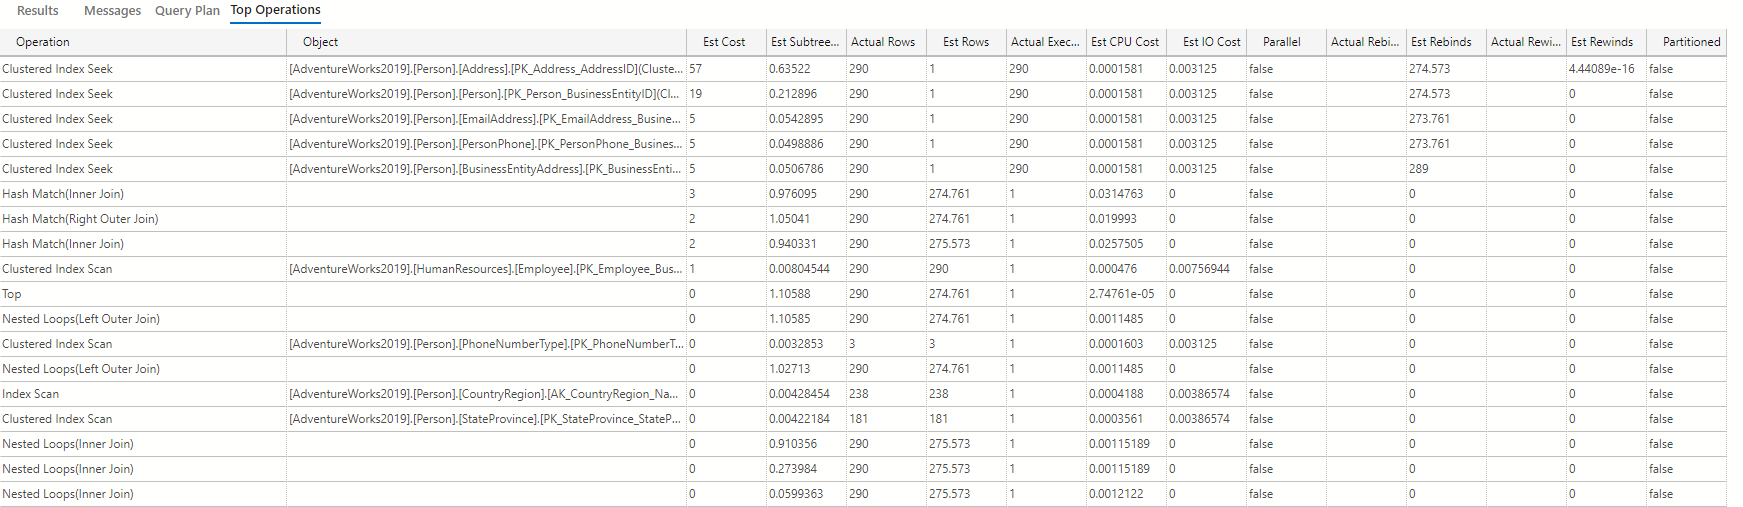
Alternatively, you can use Azure Data Studio and navigate to Run Current Query with Actual Plan under the Command palette. This gives an actual execution plan in a compact form, along with the Top operations to quickly identify costly operators.
Showplan analysis
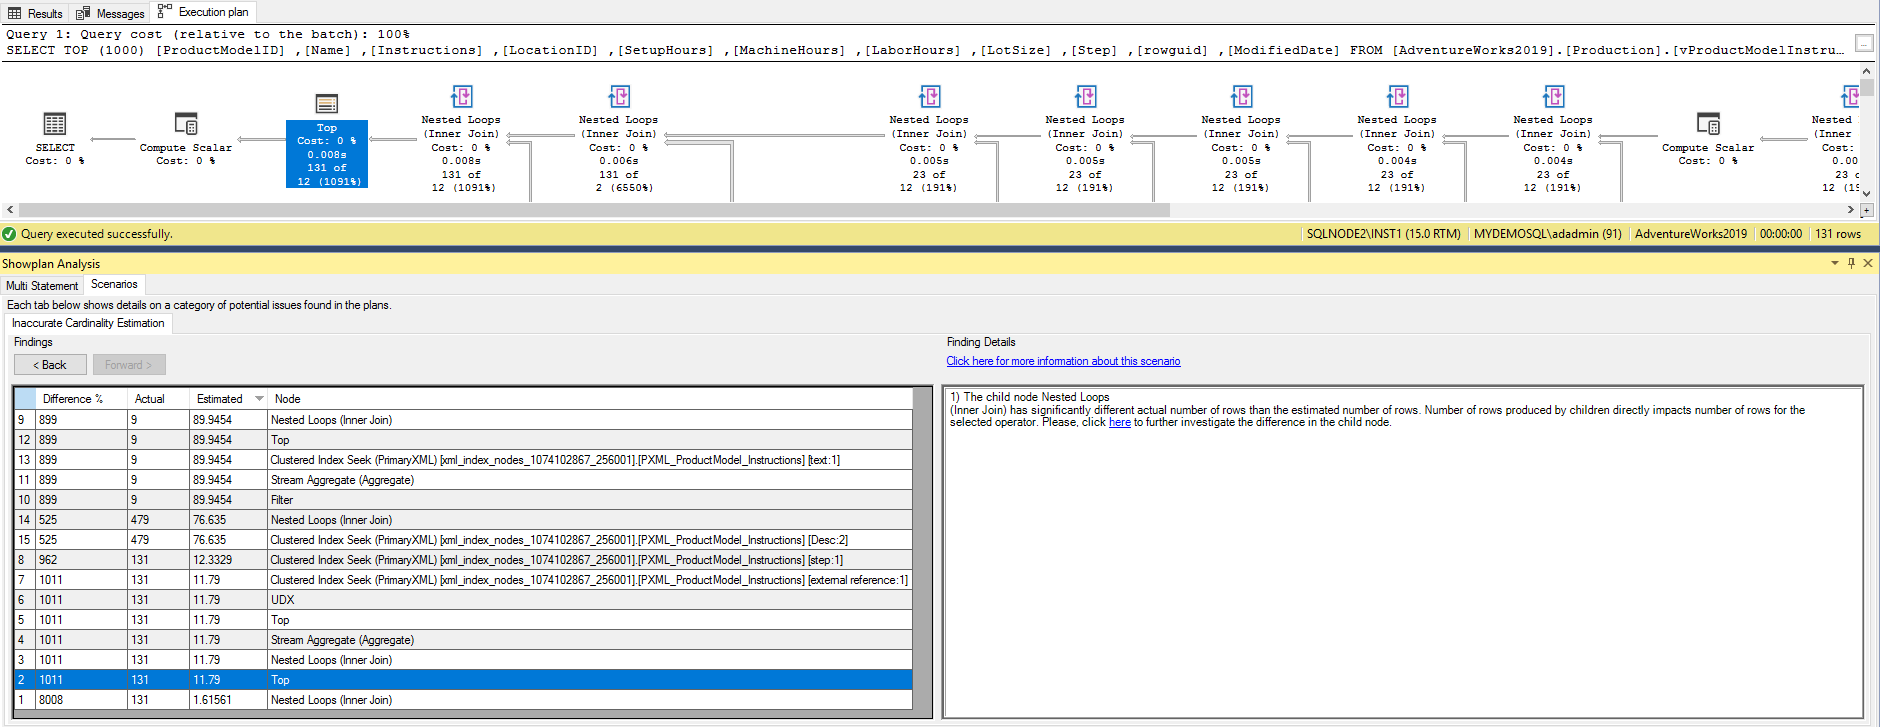
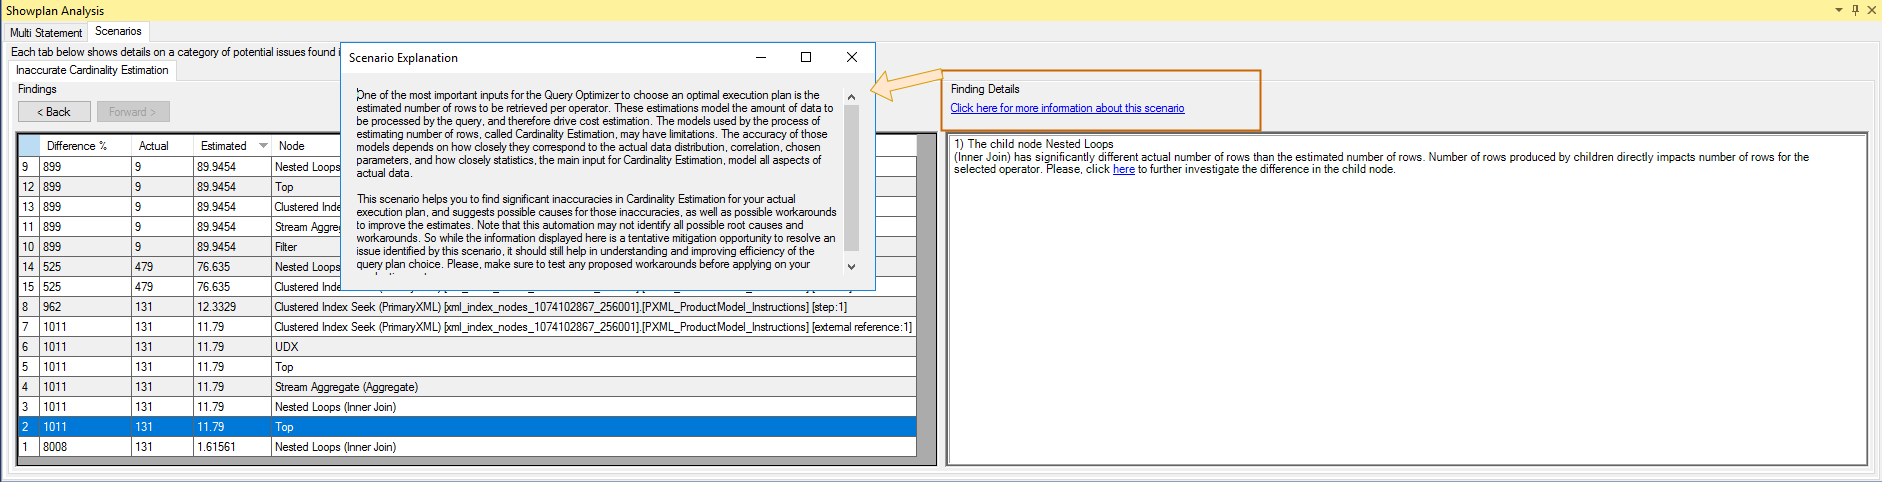
You can identify an Inaccurate Cardinality Estimation to investigate problematic execution plans. This will give you brief information about finding a particular operator and recommendations in the ShowPlan Analysis tab. You can sort the result in the difference, actual and estimated columns to find the problem and recommendations for the specific operator in the execution plan. This is available from SSMS 17.4.
To do this, just right-click on the execution plan and then click on Analyze the Actual Execution Plan.

Then, click on the hyperlink under Finding Details. This will explain the possible scenarios for estimation inaccuracy and workarounds to improve these estimates. It’s a good starting point for cardinality estimation issues.
Compare Showplan
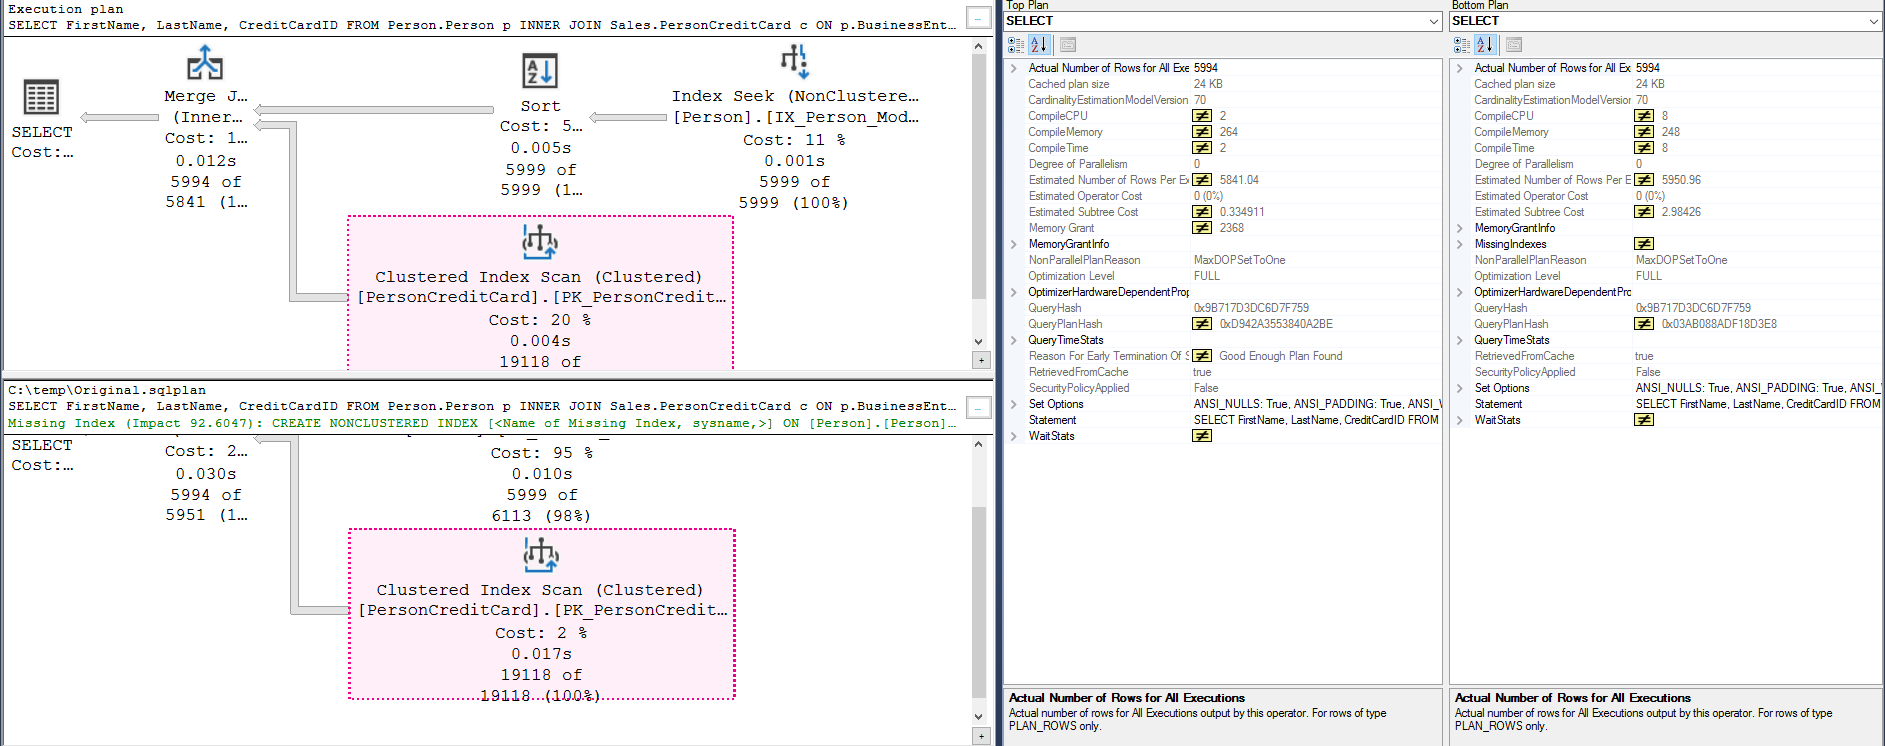
Suppose you identified an issue in the execution plan and you implemented a solution to remediate it. But, how will you compare the previous execution plan (how it was before implementing the solution) and the current execution plan? The SSMS Compare Showplan feature gives you the flexibility to compare two execution plans. It highlights the similarities and differences between these plans.
Usually, DBAs get a call from developers that a particular query is working fine in production but is taking a long time in a QA environment with the same parameters. Another use case is migrating to a newer version of SQL Server. Suppose after the migration, you face issues with a query that works fine in a lower SQL version. You can use this tool to compare execution plans of different SQL versions and patch levels as well.
Save the execution plan in a SQLPlan extension. After that, you can right-click on another execution plan and select Compare Showplan.
Live execution plans in SSMS
You can enable a live execution plan of an active query. This will give you real-time statistics about the data flow to different operators. In the run time execution statistics, you can track the elapsed time and number of rows. It is an excellent feature for troubleshooting and debugging performance issues. You can use live query statistics from SQL Server 2016 and above.
Note: You should use the SSMS latest version. Refer to Microsoft docs to download the latest version of SSMS.
- Current latest version: SSMS 18.7.1
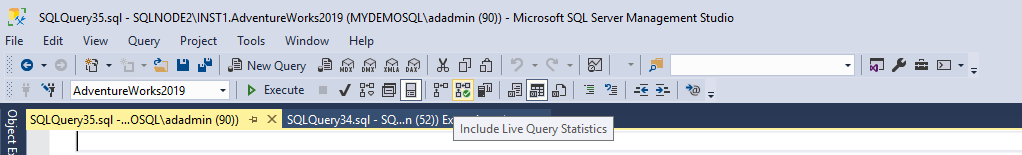
For live query statistics, turn on Include Live Query Statistics using the SSMS toolbar.
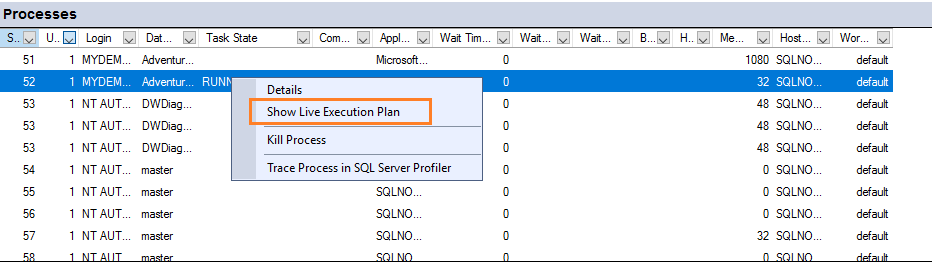
You can also view the live execution plan from the Activity Monitor. In the Activity Monitor, select the desired process, right-click on it to view the menu and choose Show Live Execution Plan.
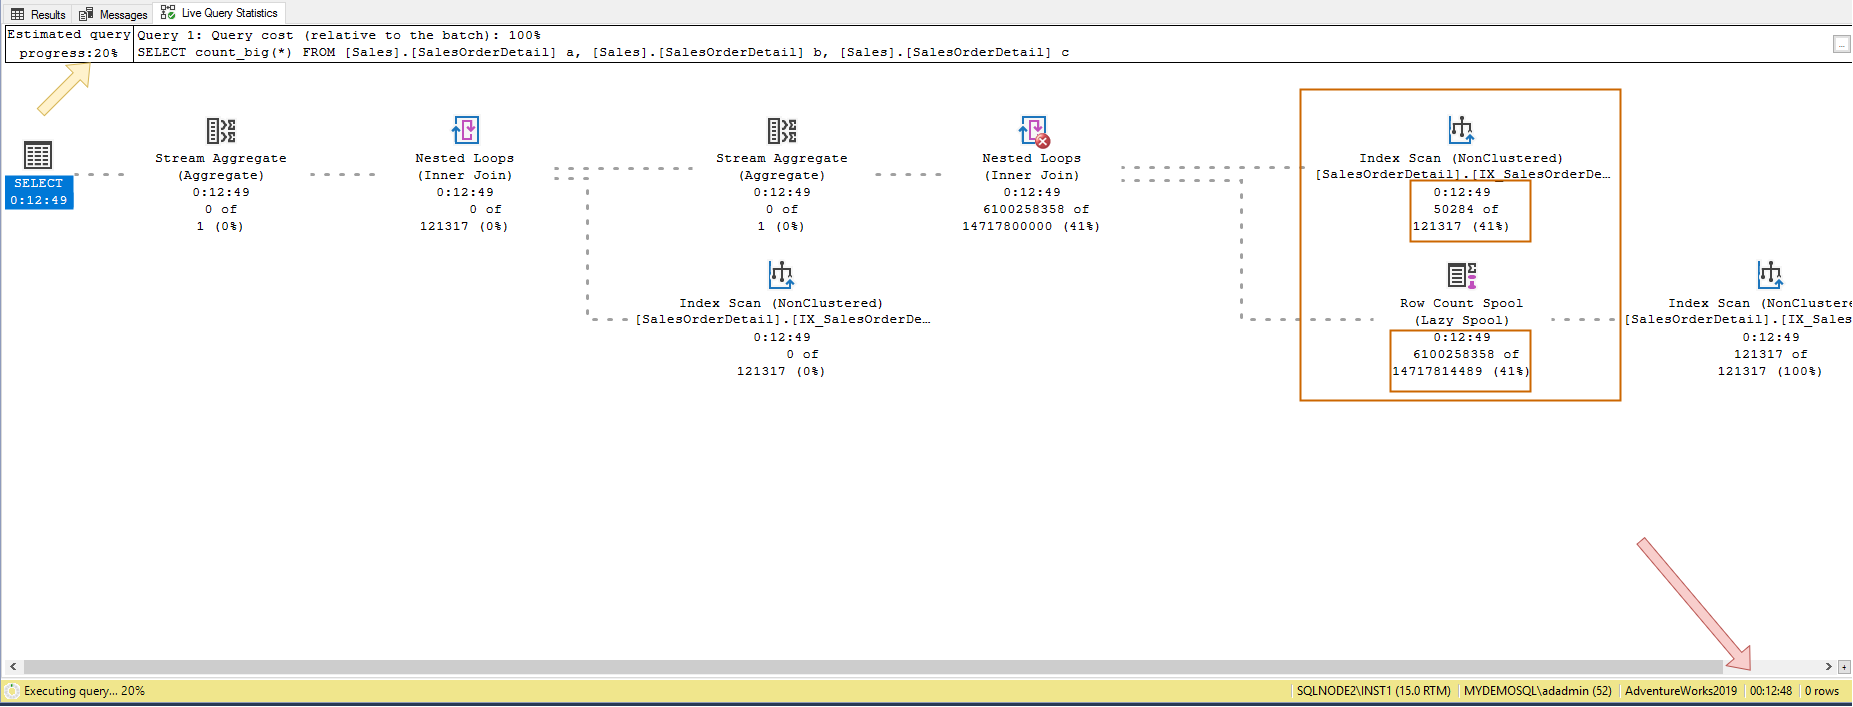
This gives you live query estimates along with data flow and completion percentages of individual operators. Usually, we wait for query execution to finish and view the actual execution plan. But, suppose your query takes more than 30 minutes to produce results. In this case, you can use live query statistics to track individual operators, data flow and point out which operator is taking time to complete the query. For example, as shown below, the query is running for 12 minutes 48 seconds, and the query is estimated 20% completed. At the operator level, the index scan and row count spool are 41% completed. The dotted lines show the data movement.
Reviewing SQL Server execution plan usage
SQL Server execution plans are incredibly useful in troubleshooting and optimizing slow queries. Every database professional needs to know how to analyze and understand the information once the execution plan becomes available. As covered earlier, there are various tools in SSMS and Azure Data Studio to help you review and resolve performance issues—the Compare Plan feature especially is one to take advantage of as you begin making changes and assessing performance.