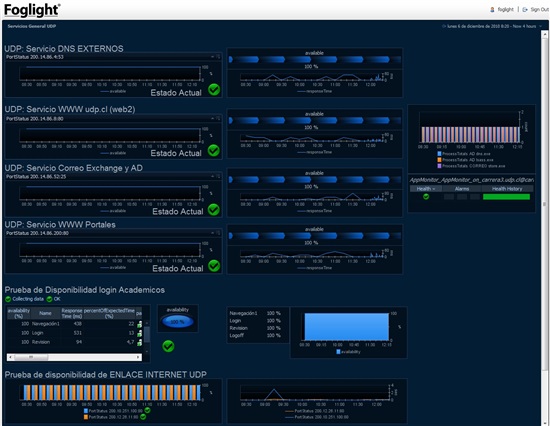
This dashboard was created for the IT operational/support persona and services states.
The purpose of this dashboard is to consolidate the health of all basic infrastructure and services of the company thru main indicators/alarms about services and uptime:
- Service with response times and availability
- End User Layer (response time and availability), Web application with transactional sintesis and monitoring Application Layer (web server and OC4J containers), Database Server and Operating System Layer (Windows).
- Internet Access Monitor.
The company is running a web application (Internet). It has :
Platform:
- Windows Servers (DNS, Active Directory, Exchange Server, Web Services, DataBase Server)
QUEST PRODUCTS:
- Foglight Managment Server
- Foglight OS Management
- Foglight End User Experience Managment FTR (Robot)
This dashboard and implementation is running all time (24x7) on the operational monitor / console inside the servers room and alert with SMS and Emails.
When any indicator/alarm changes from green to orange/red or other situation, FogLight send SMS and Emails alert automatically to the infraestructure team to investigate de problem.
Regards,
Enzo Paolo Gaggero
Dashboard_UDP.jpg


