Foglight's Infrastructure cartridge collects process information by default. The Infrastructure WindowsAgent collects information about Services by default.
But these metrics are not exposed in the Infrastructure dashboards.
This custom dashboard cartridge provides dashboards and portlets for visualizing these metrics.
The module is intended as a stop-gap until the Guest Process Investigation views from the virtualization cartridge are migrated to the Infrastructure cartridge in the next major release.
This is a community provided cartridge, so Dell can't provide support. If you have any questions or issues leave a comment and we'll assist on a best effort basis. The cartridge is expected to work on Foglight version 5.6.2 and higher. With Foglight version 5.9.x this customization will not work anymore.
Dashboards
The module contains three dashboards:
- Processes by Host
- Processes by Service
- Services by Host
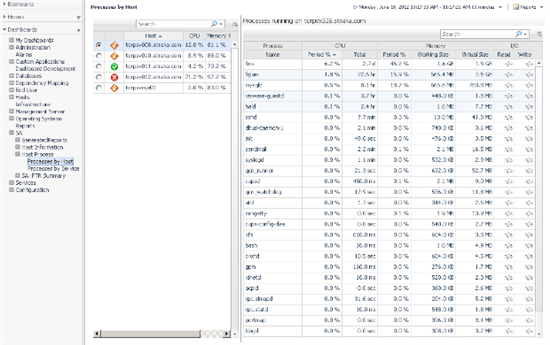
Processes by Host is a splitter window with a list of Hosts that have process metrics on the left, and a list of monitored processes from that host on the right.
For each process, CPU, Memory, and I/O metrics are displayed if available.
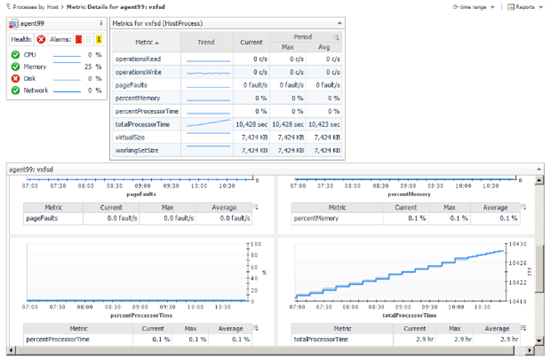
Clicking on a process drills down to a page with Host Summary, process metric summary, and time charts and summaries for each metric:
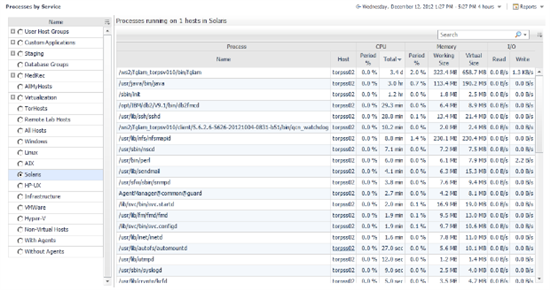
Processes by Service is a splitter window with a list of Foglight Services on the left, and a list of monitored processes from all hosts in that Service on the right. This view allows you to aggregate and compare processes running on multiple hosts.
Like the Process by Host dashboard, this dashboard supports simple and advanced filtering and drilldown to process metric details.
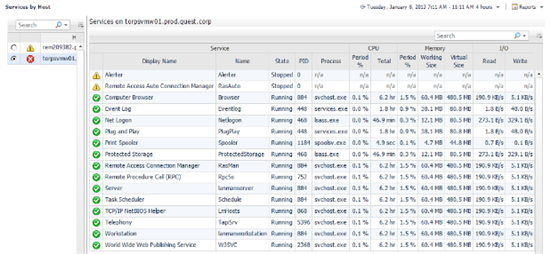
Services by Host is a splitter window with a list of Windows hosts that have service metrics on the left, and a list of monitored services from that host on the right. This dashboard displays Windows Services rather than the Foglight Services shown in the previous dashboard.
Portlets
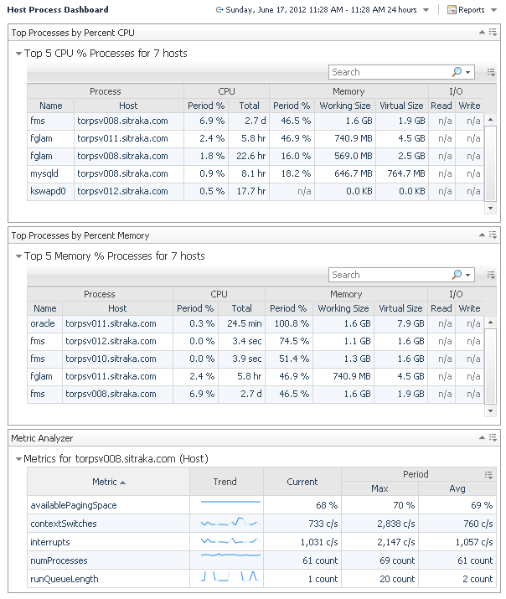
The module contains drag and drop portlets showing useful process summaries:
- Top N Processes with the highest % CPU Utilization (Service)
- Top N Processes with the highest % Memory Utilization (Service)
- Top Processes by Percent CPU in Service (Service)
- Top Processes by Percent Memory in Service (Service)
- Top Processes by Percent CPU (Host)
- Top Processes by Percent Memory (Host)
- HP Metric Analyzer (TopologyObject)
Setup
To get the cartridge contact our PSO team. Install on your 5.6.2+ FMS from the Cartridge Inventory dashboard. Note: this is not supported for Foglight version 5.9.x
The dashboards will be available in the SA/Host Process module.
The portlets will be available when you drop a target Service, Host(s), or Topology Object on a (re)portal and choose Select View.
Feedback
If you install this custom dashboard and use it successfully (or not), please comment, rate or 'like' below.
Remember that this custom dashboard is not supported by Dell, only by the Foglight Community.
Happy Dashboarding!
Other dashboards by Brian Wheeldon
Java Application Server JVM Summary dashboard
Common Dashboard Framework for Custom Script Agents and Utility OS Agents
Custom Terminal Services Dashboard
Foglight 5.6 Infrastructure Host property dashboards and (re)portlets


