• Products
    • View all products
    • Free trials
    • Buy online
  • Solutions
  • Resources
    • All Resources
    • Learning Hub
  • Trials
  • Services
    • Consulting Services
      • Overview
      • Microsoft Platform Services
      • Data Protection Services
      • Unified Endpoint Management
      • Performance Monitoring Services
      • Database Management Services
    • Educational Services
    • Support Services
  • Support
    • Support Home
    • By Product
      • All Products
      • AppAssure
      • Archive Manager
      • Change Auditor
      • Desktop Authority
      • DR Series
      • Foglight
      • KACE
      • Migration Manager
      • NetVault
      • Rapid Recovery
      • SharePlex
      • Toad
      • vRanger
    • Contact Support
      • Overview
      • Customer Service
      • Licensing Assistance
      • Renewal Assistance
      • Technical Support
    • Download Software
    • Knowledge Base
    • My Account
      • My Products
      • My Service Requests
      • My Licenses
      • My Groups
      • My Profile
    • Policies & Procedures
    • Consulting Services
      • Microsoft Platform Management
      • Data Protection
      • Unified Endpoint Management
      • Performance Monitoring
      • Database Management
    • Technical Documentation
    • Educational Services
    • User Forums
    • Video Tutorials
  • Partners
    • Overview
    • Partner Circle Log In
    • Become a Partner
    • Find a Partner
    • Technology Partners
    • Partner Community
    • Deal Alert
  • Blogs
    • IT Industry Insights
    • Quest Solution Blogs
      • Data Protection
      • Database Management
      • ITNinja
      • Microsoft Platform Management
      • Performance Monitoring
      • Toad World Blog
      • Unified Endpoint Management
  • Forums
  • 製品情報
    • すべての製品情報%E3%82%92見る
    • Change Auditor
    • Foglight
    • KACE
    • Metalogix
    • Migration Manager
    • Migrator for Notes to SharePoint
    • NetVault Backup
    • On Demand Migration for Email
    • QoreStor
    • Rapid Recovery
    • Recovery Manager
    • SharePlex
    • Spotlight
    • Toad
  • ソリューション
    • すべてのプラットフォームを見る
    • クラウド管理
    • GDPRコンプライアンス
    • データ保護
      • 概要
      • クラウド管理
      • ディザスタリカバリ
      • バックアップとリカバリ
      • Office 365 データ保護
      • 仮想化管理
      • 重複除外と複製
    • データベース管理
      • 概要
      • DevOps
      • データの準備と分析
      • データベースのクラウド移行
      • データベースパフォーマンス監視
      • データベース管理
      • データベース複製ソフトウェアツール
    • 統合エンドポイント管理
      • 概要
      • エンドポイントコンプライアンス
      • エンドポイントセキュリティ
      • エンドポイントの可視化
    • Microsoftプラットフォーム管理
      • 概要
      • ハイブリッドActive Directoryのセキュリティとガバナンス
      • Microsoftプラットフォームの移行計画と統合
      • セキュリティとコンプライアンス
      • 情報アーカイブおよびストレージ管理ソリューション
      • Windowsのバックアップとリカバリ
      • Microsoft Serverのパフォーマンスと可用性
      • レポート作成機能
      • グループポリシーと権限
    • パフォーマンス監視
  • サービス
    • コンサルティングサービス
      • 概要
      • Microsoftプラットフォーム管理
      • データ保護
      • 統合エンドポイント管理
      • パフォーマンス監視
      • データベース管理
    • トレーニングと認定資格
    • サポートサービス
  • サポート
    • サポートホーム
    • 製品で検索
      • All Products
      • AppAssure
      • Archive Manager
      • Change Auditor
      • Desktop Authority
      • DR Series
      • Foglight
      • KACE
      • Migration Manager
      • NetVault
      • Rapid Recovery
      • SharePlex
      • Toad
      • vRanger
    • お問い合わせ
      • すべて
      • カスタマサービス
      • ライセンス アシスタンス
      • 更新のアシス%E3%82%BFンス
      • 技術サポート
    • コミュ%E3%83%8Bティフォーラム
    • ソフトウェアのダウン%E3%83%ADード
    • ナ%E3%83%AC%E3%83%83ジ%E3%83%99ース
    • マイアカウント
      • マイ プロダクト
      • Myサービスリクエスト
      • マイ ライセンス
      • マイ グループ
      • マイ プ%E3%83%ADフ%E3%82%A1イル
    • ポリ%E3%82%B7ーおよび手順
    • コンサル%E3%83%86ィングサー%E3%83%93ス
      • Microsoftプラットフォーム管理
      • データ保護
      • 統合エンドポイント管理
      • パフォーマンス監視
      • データベース管理
    • リリースノートおよびガイド
    • 教育サービス
    • ビデオチュートリアル
  • トライアル
  • パートナー
    • 概要
    • Partner Circleへのログイン
    • パートナーになる
    • Find a Partner
    • パートナーコミュニティ
    • Deal Alert
  • コミュニティ
Quest Community
Quest Community
  • Site
  • User
  • Site
  • Search
  • User
Foglight
Foglight
Custom Dashboards and Scripts Monitoring .NET Request Memory Usage with Foglight
  • Forum
  • Wikis
  • Sub-Groups
  • More
  • Cancel
  • New
  • -Main Page
    • Alarms Analysis Dashboard
    • Common Dashboard Framework for Custom Script Agents and Utility OS Agents: Apache, NetMonitor, SNMP, WebMonitor
    • Countdown Timer Widget
    • CreateSubscriber Dashboard
    • Custom dashboard for Solaris Zones (for Infrastructure HostAgent 5.6.7)
    • Custom Dashboards for FxM
    • Custom Terminal Services Dashboard
    • Dashboards and Portlets for Infrastructure Process and Service Metrics
    • Foglight 5.6 Infrastructure Host property dashboards and (re)portlets
    • Foglight Agent Manager Status WCF Dashboard
    • Foglight Dashboard Rotation
    • Foglight Service Portlets
    • Folder Monitoring for Critical Application Dashboard JbBoss Log monitoring
    • HADR - ALWAYS ON AG Report / Dashboard
    • Happy Holidays (Get in the Spirit!) Who says monitoring has to be boring?
    • Host Status "jellybean" view
    • How to create a Derived Metric (to count powered on VMs)
    • How to create a Derived Metric to count log file errors
    • HR - USA View
    • Java Application Server JVM Summary dashboard
    • JEE Dashboard
    • Mailflow
    • Milton Vs Lumbergh : with Cloud Health
    • Milton's TPS Report
    • Monitoring .NET Request Memory Usage with Foglight
    • Monitoring Storage System HP EVA with Quest FogLight
    • +Operational Dashboard
    • Replica of Geo dashboard
    • SAMPLE Dashboard Submission
    • SLA Reports Cartridge
    • The Hockey Rivalry Dashboard
    • University Dashboard - Internet Application Monitoring
    • Virtual Desktop Infrastructure and Application Dashboard - vWorkSpace-Parallels
    • Virtual Overview 1
    • Virtual Overview 2
    • VMware Cluster capacity over time
    • VMware Cluster capacity time until full
    • VMware Top Info Page
    • Windows Event Log Dashboard
    • World Map - Alarms
  • Countdown to Christmas
  • Foglight dashboarding refresher - Halloween 2014

Monitoring .NET Request Memory Usage with Foglight

Greetings Foglighter's,

Today I have an add-on to the Foglight 5 .NET cartridge for you that will help you monitor the memory usage of your .NET applications.

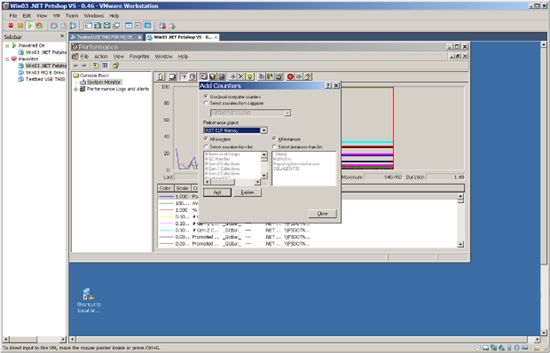
Your .NET code runs throught Microsoft's Common Language Runtime (or CLR). This engine provides statistics on its heap usage, just as a Java JVM would do. Foglight 5's .NET agent is able to collect this heap usage information for traced instances of .NET Request Types. In order for Foglight to see this information, you'll need to make sure that the Windows host or VM where the CLR is running has been instructed to surface the proper Performance Counters. One easy way to do this is with the perfmon tool. You can launch perfmon from any Windows command prompt, or from Start -> Run. Once perfmon is up, you can check

the Performance Counters that are currently surfaced, and add the .NET CLR Memory counters if they are not present:

Once you know this information is present you can deploy the cartridge which is attached to this article. Remember that you'll need to already be using the Foglight 5 .NET cartridge. The add-on was built and tested assuming the presence of version 5.6.6 of our .NET cartridge.

The add-on installs the following entities:

1. A derived metric called NETRequestAllTracesClrMemoryUsedInAllHeaps. This is a calculation which looks up all recorded performance traces of a given .NET Request Type and produces an average value for the .NET Performance Counter called Bytes in all heaps (which is hung off the .NET CLR Memory performance object).

2. A second derived metric called NETRequestLatestTraceClrMemoryUsedInAllHeaps. This derived metric finds the most recent performance trace of a given .NET Request Type, and produces the Bytes in all heaps data for this trace.

3. A rule called NETRequestMemoryDeviation that compares the value of these two metrics and alarms if their difference is greater than some threshold, which in this case is the value of a Foglight Registry Variable called .NETRequestTraceMemoryDeviationWarning, which the cartridge also installs.

Here's a sample alarm generated by this rule:

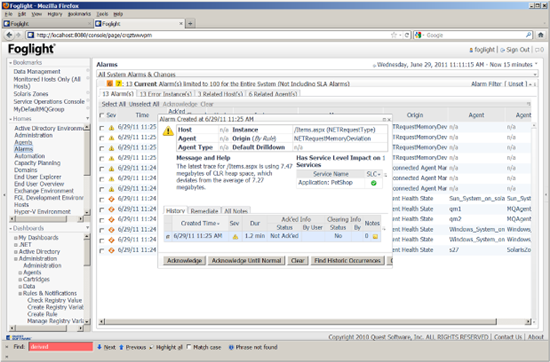
The rule functions by making a very simple calculation: the difference between the values of NETRequestLatestTraceClrMemoryUsedInAllHeaps and NETRequestAllTracesClrMemoryUsedInAllHeaps. Of course, it would be straightforward to create more sophisticated calculations such as running averages, baselines, standard deviation calculations, and trend analysis. For the time being anyway, I'll leave these as exercises for the reader. 

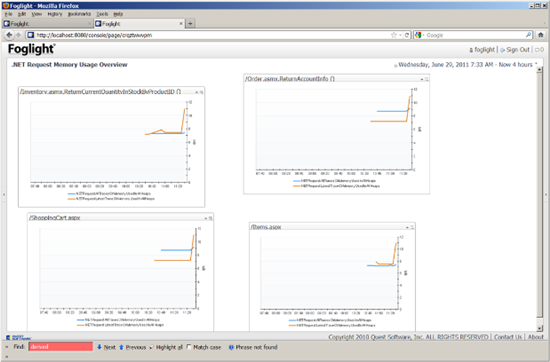
Visualizing this data can be very informative. Here's a quick drag & drop dashboard that shows the two metrics graphed together for a few representative .NET Requests:

That's it for now. I hope you enjoy this add-on and as usual, please post if you have questions.

Robert Statsinger

Attachments :

(Please visit the site to view this file)

  • metrics
  • application
  • rules
  • Monitoring
  • derived
  • Share
  • History
  • More
  • Cancel
Related
Recommended
  • Company
    • About Us
    • Buy
    • Contact Us
    • Careers
    • News
  • Resources
    • Industry Insights Blog
    • Communities
    • Customer Stories
    • Documents
    • Events
  • Support
    • Professional Services
    • Renew Support
    • Technical Support
    • Training & Certification
    • Support Services
  • Social Networks
    • Facebook
    • LinkedIn
    • Twitter
    • YouTube
  • © 2025 Quest Software Inc. ALL RIGHTS RESERVED.
  • Legal
  • Terms of Use
  • Privacy
  • Community Feedback & Support
  • Cookie Preference Center
  • 会社名
    • 会社情報
    • 購入
    • お問い合わせ
    • 採用情報
    • ニュース
  • リソース
    • ブログ
    • お客様の事例
    • ドキュメント
    • イベント
    • ビデオ
  • サポート
    • プロフェッショナルサービス
    • サポートの更新
    • テクニカルサポート
    • トレーニングと認定資格
    • サポートサービス
  • ソーシャルネットワーク
    • Facebook
    • Instagram
    • LinkedIn
    • Twitter
    • YouTube
  • © 2025 Quest Software Inc. ALL RIGHTS RESERVED.
  • 「法務」
  • ご利用規約
  • 個人情報保護方針
  • コミュニティのフィードバックとサポート