This dashboard was created for the IT operational/support peoples and services states... Many Services and application are running on Storage HP EVA. For this reason is important to know state and real use about resources and metrics.
When the storage system have problems how for example performance or simply the storage system is down (for any reason), to many services and application are affected.
Quickly I expose some cases and how I have resolved with Foglight…
How summary, for the client, the important is to know:
In General:
1.- Real State about Storage System
2.- Integrated with Foglight, metrics and alerts (Only one vision for all IT)
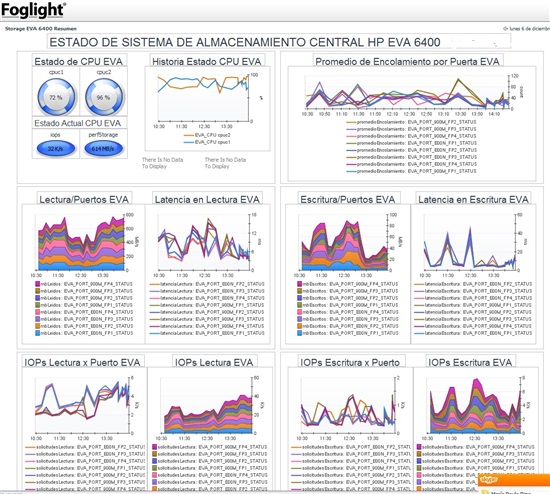
See: “Dashboard Storage System HP EVA Main.jpg”
In specific:
1.- To know state and grown the Storage Systems, CPU use and other specified metrics.
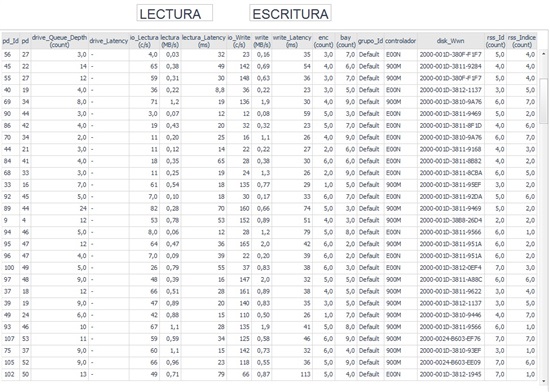
2.- To know stated of Phisical disk
See: “Dashboard Storage System HP EVA Phisical Disk States and Performance.jpg”
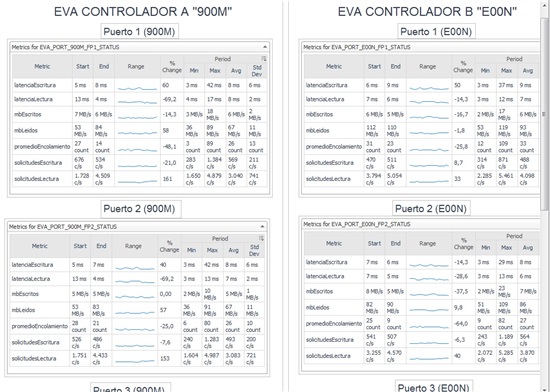
3.- To know stated of Controllers, IOps, Throughputs, Read and Writes metrics, etc.
See: “Dashboard Storage System HP EVA Controllers States and Performance.jpg”
4.- To know stated of LUNs
5.- Send Emails to different people with scale system when specified thresholds are changed
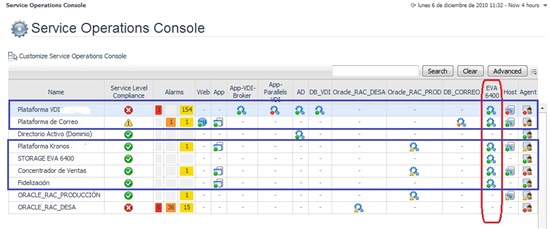
6.- Maps of Services and tree of dependence (Services what running in Storage System).
See: “Dashboard Storage System HP EVA MAPs of services.jpg”
Platform:
- Storage System
QUEST PRODUCTS:
- Foglight Managment Server
- Foglight Script Agents
This dashboard and implementation is running all time (24x7) on the operational monitor / console inside the server’s room and alert with Emails.
When any indicator/alarm changes, FogLight send Emails alert automatically to the infrastructure team to investigate de problem.
Kind Regards, Sincerely
Enzo Paolo Gaggero
Dashboard Storage System HP EVA Controllers States and Performance.jpg
Dashboard Storage System HP EVA Main.jpg
Dashboard Storage System HP EVA MAPs of services.jpg
Dashboard Storage System HP EVA Phisical Disk States and Performance.jpg


