This custom dashboard module provides additional views for FxM data, particularly FxMApplications and FxMLocations.
Dashboards
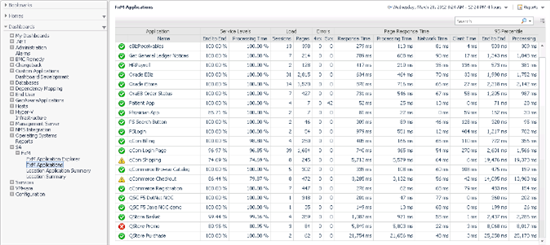
Tabular view of all FxM Application Components with key metrics for Service Levels, Load, Errors, Response Time and Percentile
This table is also available as a reportlet in the current version.
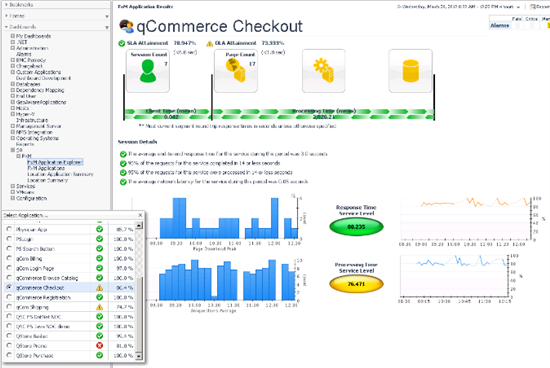
There are several good out-of-the-box views of a given FxM Application. This Explorer view combines them and provides an application selector.
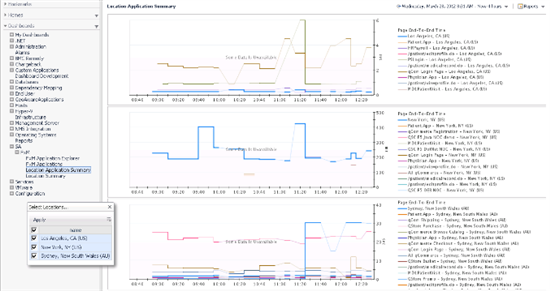
FxM Location Summary Charts:
FxM Location Application Summary Charts:
Setup
Download and unzip to extract one of the cartridges attached below. Install on your FMS from the Cartridge Inventory dashboard.
The dashboards will be available in the SA/FxM module.
The most recent version works with FMS 5.6.2 and higher.
An older version is also attached for those still using FMS 5.5.8.
Feedback
If you install this custom dashboard module and use it successfully (or not), please comment, rate or 'like' below.
Remember that these custom views not supported by Dell, only by the Foglight Community.
Other dashboards by Brian Wheeldon:
Java Application Server JVM Summary dashboard
Dashboards and Portlets for Infrastructure Process and Service Metrics
Common Dashboard Framework for Custom Script Agents and Utility OS Agents
Custom Terminal Services Dashboard
Foglight 5.6 Infrastructure Host property dashboards and (re)portlets


