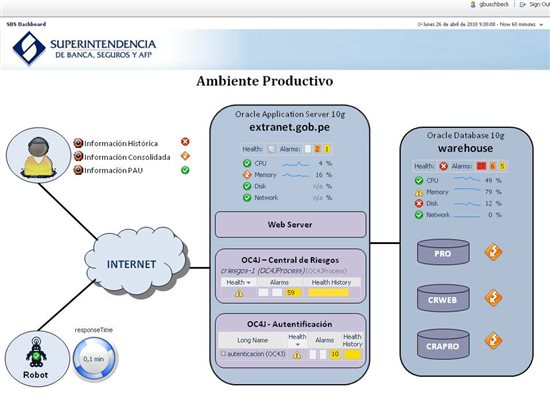
This dashboard was created for the IT operational/support persona.
The purpose of this dashboard is to consolidate the health of all infrastructure of the company thru main indicators/alarms of every layer of the company: end User Layer (response time), Application Layer (web server and OC4J containers), Database Layer (instances) and Operating System Layer (Linux).
The company is running a web application (extranet). It has :
ORACLE PRODUCTS:
1.- Oracle Database 10g (3 instances : PRO, CRWEB, CRAPRO)
2.- Oracle Application Server 10g (2 OC4J containers : Central de Riesgos and Autentificación ; and 1 web instance)
QUEST PRODUCTS:
1.- Foglight Managment Server
2.- Foglight Database Management for Oracle
3.- Foglight Applicaction Management for Java
4.- Foglight OS Management
5.- Foglight End User Experience Managment w/appliances and FTR (Robot)
This dashboard is running 24X7 on the operational monitor / console inside the servers room. When any indicator/alarm changes from green to orange/red, the operator call the dba,developers or the infraestructure team to investigate de problem.
Regards,
Foglight Dashboard Contest.jpg


