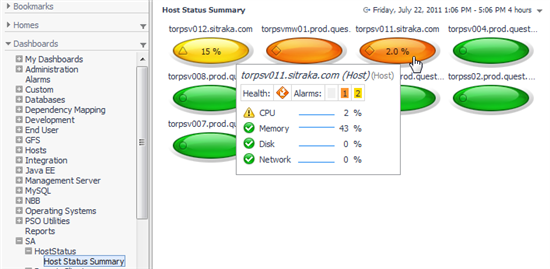
A community member asked for a "jellybean" status indicator view to represent the status of a Host.
When you click on the bubble, the view should drill down to the Host Monitor page.
It turned out to be pretty simple to implement this view using the WCF Definition editor.
The cartridge attached (for FMS 5.5.8 and higher) includes a sample dashboard that looks like this:
The color of the "jellybean" indicates the aggregate alarm status of the host and the current CPU utilization is shown if available.
If you click on one of the hosts, it drills down to the Host Monitor dashboard as required. If you rest the mouse on the view, you get the host summary popup shown in the screenshot above.
You can create a custom dashboard by dragging and dropping a Host object, and selecting the "Host Status Jellybean" view (in SA/HostStatus).
Please rate, Like, or comment on this post if you think its useful!
Regards,
Brian Wheeldon


