Hi All,
Recently a customer asked for a number of portlets that they could use to display information about their SLA's in drag and drop dashboards. Since I could see these being useful to others I thought I'd share them.
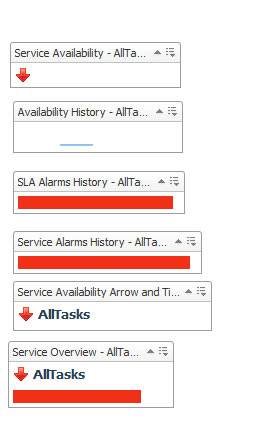
In the attached cartridge you'll find (shown in the same order in the below screenshot)
An availability arrow for your service.
A Sparkline showing availability (based on the current timeframe)
A histogram for SLA alerts on your service
A histogram for alarms in a service (regardless of whether they affect the SLA)
An availability arrow with the service name included
A small summary widget combining the arrow, name, and alarm (non SLA) histogram.
In order to use these, simply create a drag and drop dashboard, drag a service onto the canvas and choose "views". You'll find them under "service widgets".I'd love to hear any feedback or suggestions for new portlets, so please leave a comment if you try these out or tweet me @Leefarrar
As this is a community provided cartridge Quest can't provide support, but if you do have any issues leave a comment and I'll try and help out as soon as possible. The cartridge is tested on Foglight version 5.5.8.


