NOTE:
The TerminalServer agent is part of the legacy OS Cartridge which entered limited support in October 2012 will enter Support Discontinued alongside Foglight version 5.5.8 in January 2014.
If you expect to have a business requirement for this agent going forward, please contact your Foglight representative with the details.
I recently had the opportunity to collaborate with a customer who uses the TerminalServer agent to monitor the availability and key metrics for a farm of Citrix Terminal Service hosts. The TerminalServer agent is a component of the legacy OS cartridge and collects key metrics related to (Citrix) session.
The result was a custom dashboard module that displays:
- key metrics from all Terminal Server agents in a table
- a drilldown showing the metric history for a slected Terminal Server agent
- a Service-oriented Terminal Service (re)portlet
Here are some screenshots:
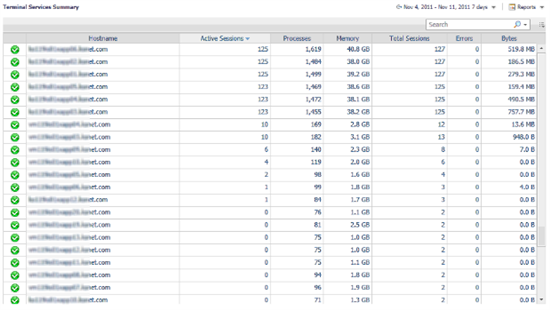
Active sessions, number of sessions, memory use, total sessions, errors and bytes transfered across all deployed Terminal Server agents in a sortable, fiterable list.
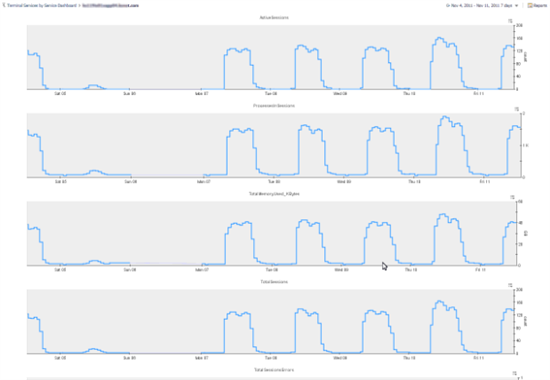
Drill down to view a metric history for all metrics collected from the selected Terminal Server.
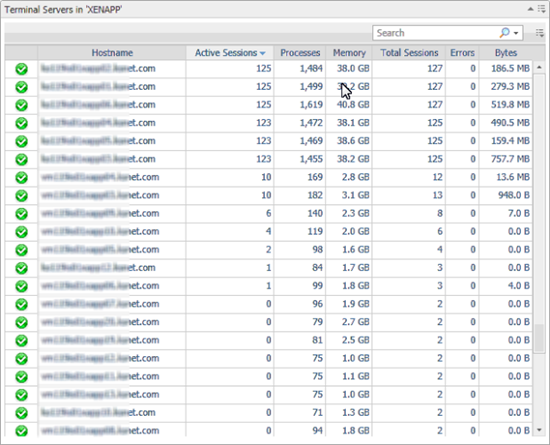
(Re)portlet showing key metrics (with drilldown) for all TerminalServer agents in a particular Service.
Drag and drop the Service on a (re)portal and select this view from the TerminalServer module).
Remember that this custom dashboard is not supported by Quest, only by the Foglight Community.
Happy Dashboarding!
Brian Wheeldon


