by Brian Wheeldon, Solution Architect
I've been working with Foglight 5.6 intensely for that last few weeks and I've learned to appreciate the capabilities of the new Infrastructure cartridge.
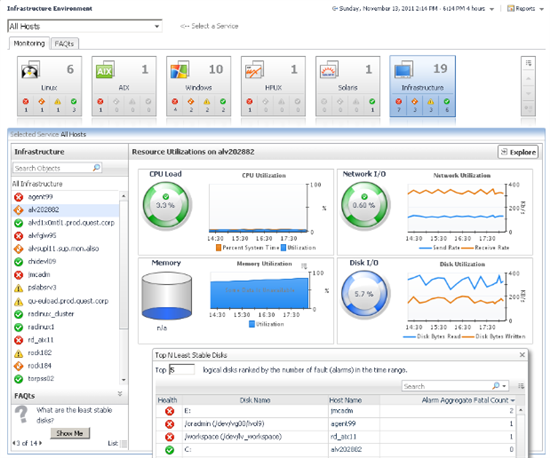
Not only does this agent support remote monitoring of Windows, Linux, Solaris, AIX and HP OS metrics, it also comes with a very nice new dashboard called "Infrastructure".
This new dashboard presents a set of hosts in a Service, then breaks down the hosts into a configurable set of OS perspectives.
You get a summary of key resource metrics across all machines in that service, with the ability to select a specific host and see key metrics for that machine.
The dashboard also provides a set of "FAQts". For example:
What are the disks that are likely to run out of space?
What are the hosts with the highest CPU consumption?
etc.
While resource-based analysis is great, I haven't seens any good ways to view the static properties of hosts like OS name and version, CPU and memory capacity etc.
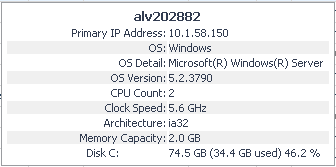
So I started by creating a view that presents these (more or less) static properties in one compact grid:
I made this view public and tagged it as a portlet and a reportlet so you can drag and drop a Host onto a custom dashboard or report and select this view. The view is in module SA/Host Information/Host Property Summary.
That's when I started to asked myself about the context in which this view might be most useful. I asked myself::
- What if you could wrap this view with a Service selector so you can see information about all the hosts in a Service?
- What if there were too many hosts to make that view useful? Wouldn't it be better if this information what displayed in a searchable, filterable table, where you can hide or show individual properties at will?
- Wouldn't it be useful to see a histogram showing the number of hosts for each OS type?
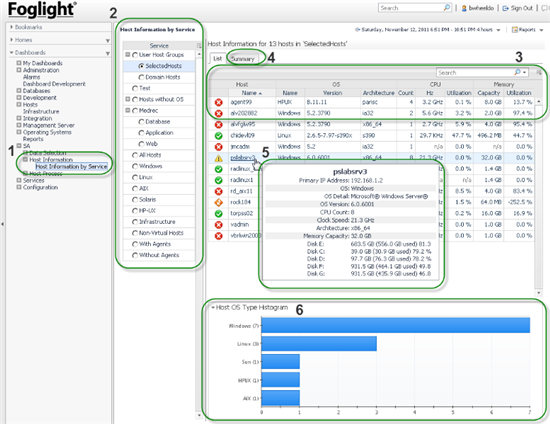
So I started hammering away in the WCF definition editor and this is the result:
- This dashboard is stored in a module called "Host Information" in the"SA" group.
- The Service Selection combines OOTB System Services, user defined System Services,and Application Services created with the Service Builder. The tree presents nested hierarchies of services.
- The tabular view of host properties can be filtered and sorted. There are a number of hidden columns that can be exposed on demand. This table is a (re)portlet view that can selected when you drag and drop a list of hosts (e.g. from a Service) on a (re)portal.
- This tabbed interface enables switching between this tabular view and the iterator showing all the summary views.
- Summary properties of a host can also be dragged and dropped on a custom dashboard or report.
- Histogram showing the count of each OS type in the selected service.
The cartridge requires FMS 5.6.2 and you'll need to have one or more Infrastructure agents running to populate all these properties. VMWare and legacy OS agents will populate a subset of them.
To get the cartridge please contact our PSO team.
This customization is offered on an as-is basis with no implicit or explicit support as outlined in the Quest Support Policy for Customization. If you have any problems or questions about this customization, please post below and I (and the Foglight Community) will make a best effort to assist you.
Happy dashboarding,
Brian Wheeldon


