
Quest Solution Architect Brian Wheeldon announces a custon dashboard framework to help you speed up your custom agent development.
Introduction
Creating drag and drop dashboards for custom agents can time-consuming and these cannot easily be saved and packaged with the custom agent. Creating WCF dashboards takes even longer. This custom dashboard cartridge provides a quick and easy starting place for viewing and sharing your custom Metrics and StringObservations in a dashboard. It leverages the common structure of all F4 migrated agents and F5 script agents (F4Agent->tables->F4Table->metrics).
The framework consists of a top-level module called "Custom", a submodule called "common", and a set of agent-specific modules for each target agent type. The "common" module contains all the "plumbing" for the framework so that you can quickly copy an existing dashboard, replace the existing agent type name with the name of your custom script agent, then easily view all the tables and metrics produced by your script agent.
The cartridge includes example dashboards for utility agents contained in the legacy OS cartridge: ApacheSvr, NetMonitor, SNMP and WebMonitor. These dashboards provide value in their own right, but also provide a starting source to easily copy and configure for your own agent dashboards.
Key Features
The cartridge includes two top level dashboards that provide starting points for your agent metric investigation.
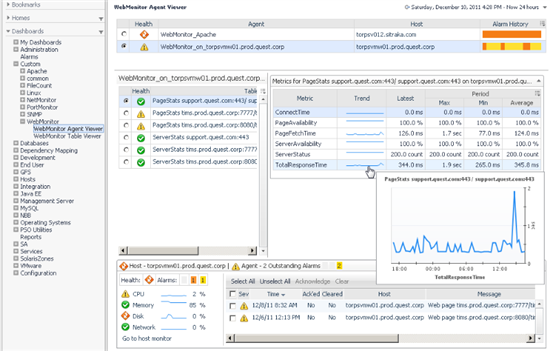
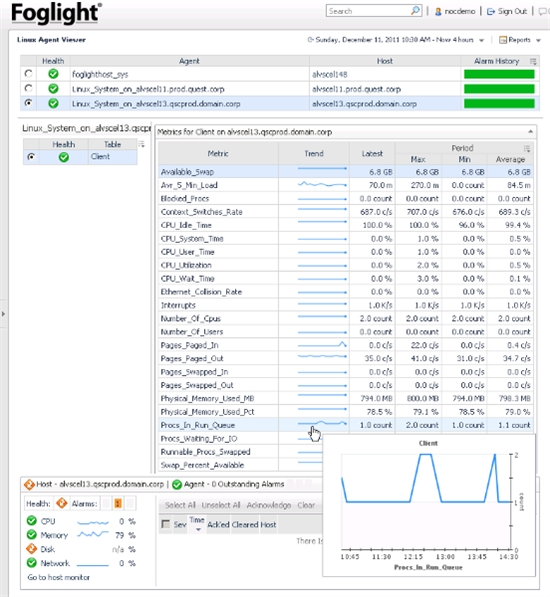
The Agent Viewer dashboard allows you to inspect the selected agent type per agent instance.
This dashboard consists of a splitter page containing four main elements:
- Agent selection summary table at the top of the page
- Table selection summary table at the left of the page
- Metric (and StringObservation) summary for the selected Table at the right of the page
- Host summary with agent-specific alarm list at the bottom of the page (initially collapsed)
The Table Viewer dashboard allows you to compare values from all tables generated by all instances
of the target agent type, optionally within a specified service.
This dashboard consists a splitter page with five elements:
- Service selector popup linked from the top of the right Action Pane
- Table type selector at the top of the page
- Filterable, sortable table instance inspector and selector below that
- Metric (and StringObservation) summary for the selected Table at the right of the page
- Host summary with agent-specific alarm list at the bottom of the page (initially collapsed)
If no service is selected, the dashboard shows all instances of the selected table type across all
instances of the target agent. It's easy to hard code a specific service if you wish.
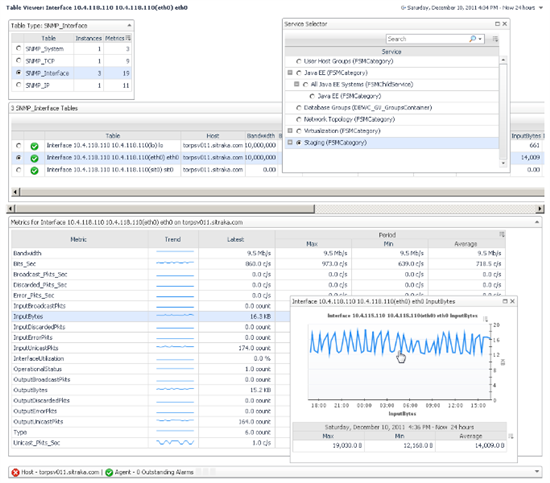
The Agent and Table selector tables display a health summary with Alarm dwell/popup, and a host summary popup.
The Metric summary view shows the name, trend, current value, and period max, min and average for the page time range.
The metric row has a chart dwell and clicking on any line brings up a chart dialog with period metric summary.
The Host summary at the bottom provides drilldowns to host alarms and resources plus a list of agent-specific alarms.
Bonus feature: The module adds a portlet for viewing StringObservations in drag and drop dashboards; there is no portlet view for StringObservations out-of-the-box:
How to Use This Cartridge
Install this cartridge on an FMS version 5.5.8 or higher.
Validate using any of the included utility agent dashboards.
Creating a agent-specific dashboard for your custom agent
With a few easy steps and ten minutes, you can have a specialized dashboard for your custom script agent. The following steps use the LinuxSystem agent as an example. You can practice these steps without a custom agent by ensuring that a LinuxSystem Agent (or WindowsSystem) agent is collecting data and building a dashboard for the "Linux_SystemAgent" (or "Windows_SystemAgent") topology type name.
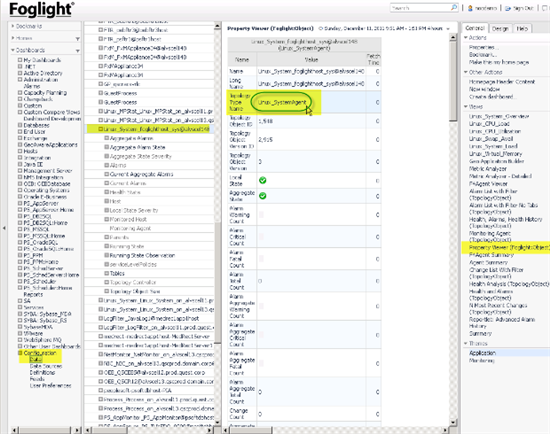
1. Find the topologyTypeName of your target (custom) agent.
This string will be used to specialize the final dashboard. Open the Configuration/Data dashboard.
Open Management Server/All Agents and select the target agent. Select the "Property Viewer (Foglight:Object)"
view from the right action panel. Note the value of "topologyTypeName".
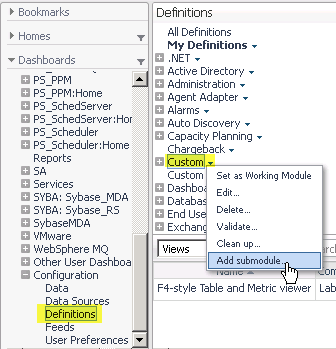
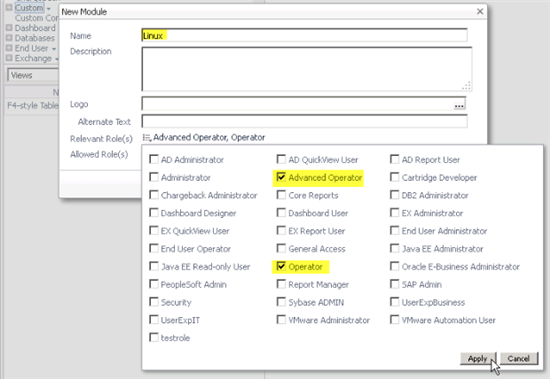
2. Create a new dashboard module for your agent.
Select the Configuration/Definitions page and click on the down arrow beside "Custom".
Select "Add submodule..."
3. Name the custom module according to your agent name and set Relevant Roles according to who should use
this dashboard.
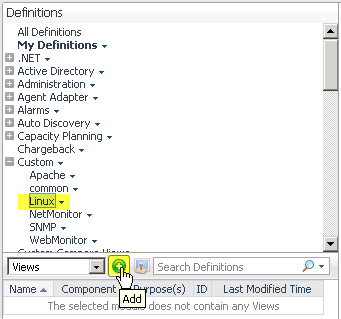
4. Add dashboards to the new module
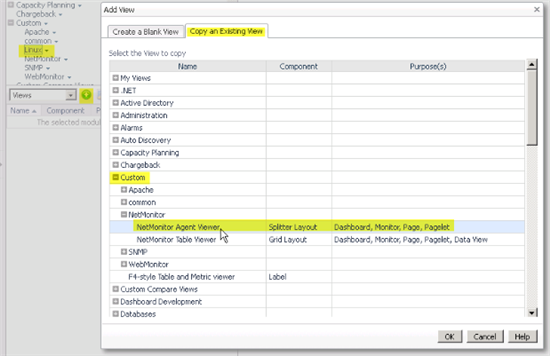
Select the new module and click Add... in the Views group.
Chose the 'Copy and Existing View' table and select an existing specialized agent dashboard (Agent Viewer or Table Viewer) and click OK.
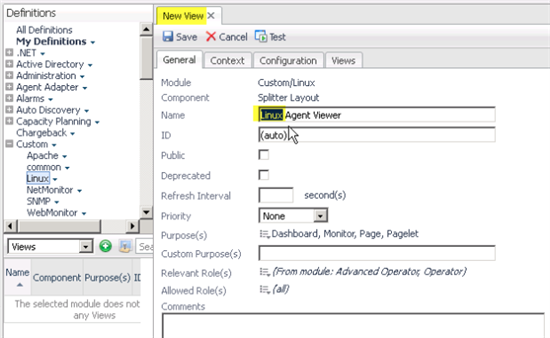
5. General Tab: Set the name of the dashboard according to the target Agent name.
6. Context Tab: Edit the AgentNames List...
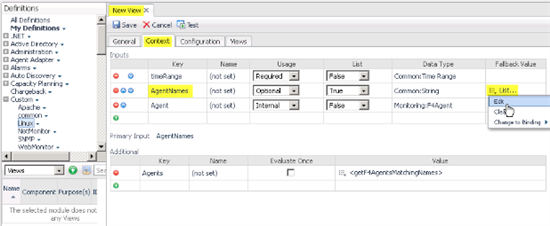
Edit the first list parameter.
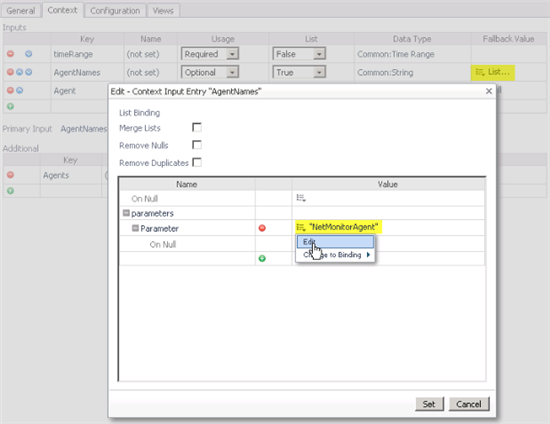
Specify the agent topologyTypeName you noted in the first step.
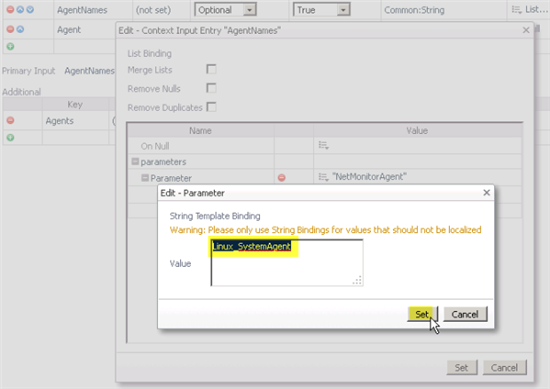
Save the Parameter. If you would like to see several types of agents in the filtered list, you can add
additional AgentNames.
Save the List. Save the dashboard.
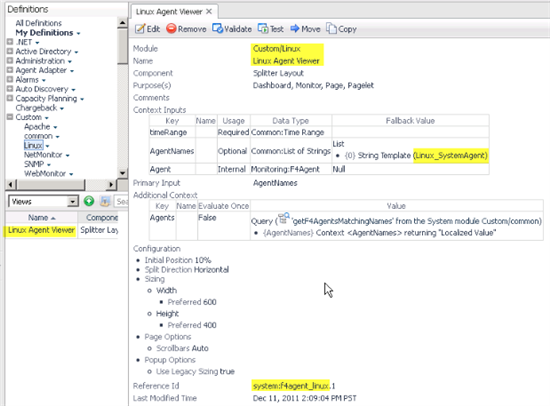
7. Review and test the dashboard
Validate the changes you made and test the dashboard, which should look similar to the first
screenshots above.
This customization is offered on an as-is basis with no implicit or explicit support as outlined in the Quest Support Policy for Customization. If you have any problems or questions about this customization, please post below and we'll make a best effort to assist you.
If you think this dashboard framework is interesting or useful (or not) please Rate (and/or Like) this page.
If you use this framework to inspect the output generated from a custom agent, please comment and include a screenshot.
If you have feedback or suggestions to enhance these views, comments are welcome!
Happy dashboarding,
Brian Wheeldon
Other dashboards by Brian Wheeldon
Java Application Server JVM Summary dashboard
Custom Terminal Services Dashboard
Foglight 5.6 Infrastructure Host property dashboards and (re)portlets