• Products
    • View all products
    • Free trials
    • Buy online
  • Solutions
  • Resources
    • All Resources
    • Learning Hub
  • Trials
  • Services
    • Consulting Services
      • Overview
      • Microsoft Platform Services
      • Data Protection Services
      • Unified Endpoint Management
      • Performance Monitoring Services
      • Database Management Services
    • Educational Services
    • Support Services
  • Support
    • Support Home
    • By Product
      • All Products
      • AppAssure
      • Archive Manager
      • Change Auditor
      • Desktop Authority
      • DR Series
      • Foglight
      • KACE
      • Migration Manager
      • NetVault
      • Rapid Recovery
      • SharePlex
      • Toad
      • vRanger
    • Contact Support
      • Overview
      • Customer Service
      • Licensing Assistance
      • Renewal Assistance
      • Technical Support
    • Download Software
    • Knowledge Base
    • My Account
      • My Products
      • My Service Requests
      • My Licenses
      • My Groups
      • My Profile
    • Policies & Procedures
    • Consulting Services
      • Microsoft Platform Management
      • Data Protection
      • Unified Endpoint Management
      • Performance Monitoring
      • Database Management
    • Technical Documentation
    • Educational Services
    • User Forums
    • Video Tutorials
  • Partners
    • Overview
    • Partner Circle Log In
    • Become a Partner
    • Find a Partner
    • Technology Partners
    • Partner Community
    • Deal Alert
  • Blogs
    • IT Industry Insights
    • Quest Solution Blogs
      • Data Protection
      • Database Management
      • ITNinja
      • Microsoft Platform Management
      • Performance Monitoring
      • Toad World Blog
      • Unified Endpoint Management
  • Forums
  • 製品情報
    • すべての製品情報%E3%82%92見る
    • Change Auditor
    • Foglight
    • KACE
    • Metalogix
    • Migration Manager
    • Migrator for Notes to SharePoint
    • NetVault Backup
    • On Demand Migration for Email
    • QoreStor
    • Rapid Recovery
    • Recovery Manager
    • SharePlex
    • Spotlight
    • Toad
  • ソリューション
    • すべてのプラットフォームを見る
    • クラウド管理
    • GDPRコンプライアンス
    • データ保護
      • 概要
      • クラウド管理
      • ディザスタリカバリ
      • バックアップとリカバリ
      • Office 365 データ保護
      • 仮想化管理
      • 重複除外と複製
    • データベース管理
      • 概要
      • DevOps
      • データの準備と分析
      • データベースのクラウド移行
      • データベースパフォーマンス監視
      • データベース管理
      • データベース複製ソフトウェアツール
    • 統合エンドポイント管理
      • 概要
      • エンドポイントコンプライアンス
      • エンドポイントセキュリティ
      • エンドポイントの可視化
    • Microsoftプラットフォーム管理
      • 概要
      • ハイブリッドActive Directoryのセキュリティとガバナンス
      • Microsoftプラットフォームの移行計画と統合
      • セキュリティとコンプライアンス
      • 情報アーカイブおよびストレージ管理ソリューション
      • Windowsのバックアップとリカバリ
      • Microsoft Serverのパフォーマンスと可用性
      • レポート作成機能
      • グループポリシーと権限
    • パフォーマンス監視
  • サービス
    • コンサルティングサービス
      • 概要
      • Microsoftプラットフォーム管理
      • データ保護
      • 統合エンドポイント管理
      • パフォーマンス監視
      • データベース管理
    • トレーニングと認定資格
    • サポートサービス
  • サポート
    • サポートホーム
    • 製品で検索
      • All Products
      • AppAssure
      • Archive Manager
      • Change Auditor
      • Desktop Authority
      • DR Series
      • Foglight
      • KACE
      • Migration Manager
      • NetVault
      • Rapid Recovery
      • SharePlex
      • Toad
      • vRanger
    • お問い合わせ
      • すべて
      • カスタマサービス
      • ライセンス アシスタンス
      • 更新のアシス%E3%82%BFンス
      • 技術サポート
    • コミュ%E3%83%8Bティフォーラム
    • ソフトウェアのダウン%E3%83%ADード
    • ナ%E3%83%AC%E3%83%83ジ%E3%83%99ース
    • マイアカウント
      • マイ プロダクト
      • Myサービスリクエスト
      • マイ ライセンス
      • マイ グループ
      • マイ プ%E3%83%ADフ%E3%82%A1イル
    • ポリ%E3%82%B7ーおよび手順
    • コンサル%E3%83%86ィングサー%E3%83%93ス
      • Microsoftプラットフォーム管理
      • データ保護
      • 統合エンドポイント管理
      • パフォーマンス監視
      • データベース管理
    • リリースノートおよびガイド
    • 教育サービス
    • ビデオチュートリアル
  • トライアル
  • パートナー
    • 概要
    • Partner Circleへのログイン
    • パートナーになる
    • Find a Partner
    • パートナーコミュニティ
    • Deal Alert
  • コミュニティ
Quest Community
Quest Community
  • Site
  • User
  • Site
  • Search
  • User
Foglight
Foglight
Custom Dashboards and Scripts Java Application Server JVM Summary dashboard
  • -Main Page
    • Alarms Analysis Dashboard
    • Common Dashboard Framework for Custom Script Agents and Utility OS Agents: Apache, NetMonitor, SNMP, WebMonitor
    • Countdown Timer Widget
    • CreateSubscriber Dashboard
    • Custom dashboard for Solaris Zones (for Infrastructure HostAgent 5.6.7)
    • Custom Dashboards for FxM
    • Custom Terminal Services Dashboard
    • Dashboards and Portlets for Infrastructure Process and Service Metrics
    • Foglight 5.6 Infrastructure Host property dashboards and (re)portlets
    • Foglight Agent Manager Status WCF Dashboard
    • Foglight Dashboard Rotation
    • Foglight Service Portlets
    • Folder Monitoring for Critical Application Dashboard JbBoss Log monitoring
    • HADR - ALWAYS ON AG Report / Dashboard
    • Happy Holidays (Get in the Spirit!) Who says monitoring has to be boring?
    • Host Status "jellybean" view
    • How to create a Derived Metric (to count powered on VMs)
    • How to create a Derived Metric to count log file errors
    • HR - USA View
    • Java Application Server JVM Summary dashboard
    • JEE Dashboard
    • Mailflow
    • Milton Vs Lumbergh : with Cloud Health
    • Milton's TPS Report
    • Monitoring .NET Request Memory Usage with Foglight
    • Monitoring Storage System HP EVA with Quest FogLight
    • +Operational Dashboard
    • Replica of Geo dashboard
    • SAMPLE Dashboard Submission
    • SLA Reports Cartridge
    • The Hockey Rivalry Dashboard
    • University Dashboard - Internet Application Monitoring
    • Virtual Desktop Infrastructure and Application Dashboard - vWorkSpace-Parallels
    • Virtual Overview 1
    • Virtual Overview 2
    • VMware Cluster capacity over time
    • VMware Cluster capacity time until full
    • VMware Top Info Page
    • Windows Event Log Dashboard
    • World Map - Alarms
  • Countdown to Christmas
  • Foglight dashboarding refresher - Halloween 2014

Java Application Server JVM Summary dashboard

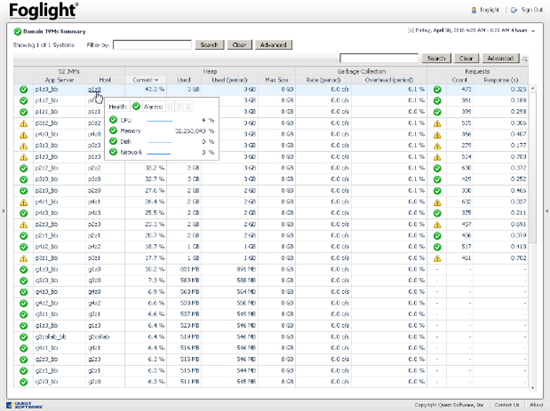
This custom dashboard provides a filterable, sortable table of App Server JVM metrics with drilldowns.

You can download a two-minute video demonstration of the dashboard from:
Full size: http://dl.dropbox.com/u/3077237/JVMHeap104.avi 9mb
iPhone: http://dl.dropbox.com/u/3077237/JVMHeap104.m4v 4.5mb

Use the filter in the top left of the screen to specify a subset of all Java Systems to display.

The filter in the top right filters by app server or host name, or, using the "Advanced" button, by metric value.

App servers that match the specified filters are shown in the table with columns representing the alarm state of the app server, name, host name, current heap%, current MB used, period avg MB used, max heap capacity, GC rate (period), GC overhead (Period), request alarm health, current request count, and current request response time. Each column is sortable and has a configured dwell view and selection popup. You can click on elements of the selection popup to drill down to an appropriate diagnostic view.

The out-of-the-box Java dashboards do a great job of navigating from the top level to any particular app server, application, resource or request, but there is no easy way to compare resources from multiple app servers without going to the page associated with the first app server, noting the value, then going to the second app server, then comparing the value.

This dashboard easily answers questions like:

- which app server is in the worst state?

- which app server has the highest heap utilization?

- which app server has the highest garbage collection overhead?

- which app server has the slowest average response time?

- which app server has the highest load?

- are my load balanced app servers all processing the same number of requests, or are they unbalanced?

The cartridge attached is ready to install on any FMS version 5.5.4 and higher.

Watch the video for details.

Use (Please visit the site to view this file) for Java cartridge 5.8.0+.

Use (Please visit the site to view this file) for FMS 5.5.8 with Java Cartridge 5.7.4 and lower..

Use (Please visit the site to view this file) for FMS 5.5.4.

Update JVMHeap 5.8.1.1 so that request metrics for Tomcat are visible on the dashboard.

Known issues:

  1. Oracle App Servers do not appear in the dashboard - workaround described in comments below.
  2. Response times for Tomcat are shown in milliseconds rather than seconds.

Other dashboards by Brian Wheeldon

Custom Dashboards for Device Availability metrics captured by the NetMonitor agent

Common Dashboard Framework for Custom Script Agents and Utility OS Agents

Host Status "jellybean" view

Custom Terminal Services Dashboard

Foglight 5.6 Infrastructure Host property dashboards and (re)portlets

Building a custom dashboard to summarize LogFilter alarms

Customizing the out-of-the-box Host Status view

(Please visit the site to view this file)

(Please visit the site to view this file)

(Please visit the site to view this file)

(Please visit the site to view this file)

  • java
  • jvm
  • heap
  • Dashboard
  • Monitoring
Related
Recommended
  • Company
    • About Us
    • Buy
    • Contact Us
    • Careers
    • News
  • Resources
    • Industry Insights Blog
    • Communities
    • Customer Stories
    • Documents
    • Events
  • Support
    • Professional Services
    • Renew Support
    • Technical Support
    • Training & Certification
    • Support Services
  • Social Networks
    • Facebook
    • LinkedIn
    • Twitter
    • YouTube
  • © 2025 Quest Software Inc. ALL RIGHTS RESERVED.
  • Legal
  • Terms of Use
  • Privacy
  • Community Feedback & Support
  • Cookie Preference Center
  • 会社名
    • 会社情報
    • 購入
    • お問い合わせ
    • 採用情報
    • ニュース
  • リソース
    • ブログ
    • お客様の事例
    • ドキュメント
    • イベント
    • ビデオ
  • サポート
    • プロフェッショナルサービス
    • サポートの更新
    • テクニカルサポート
    • トレーニングと認定資格
    • サポートサービス
  • ソーシャルネットワーク
    • Facebook
    • Instagram
    • LinkedIn
    • Twitter
    • YouTube
  • © 2025 Quest Software Inc. ALL RIGHTS RESERVED.
  • 「法務」
  • ご利用規約
  • 個人情報保護方針
  • コミュニティのフィードバックとサポート