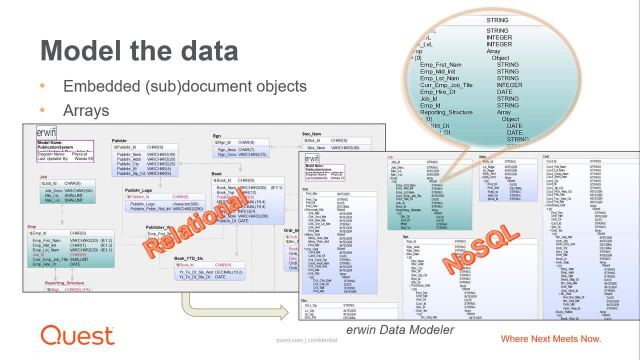
Hello, my name is Jason Hall, and today I'm going to give you a quick demonstration of how Foglight for Databases, specifically our MongoDB coverage, can help you provide insight into the health and status of your MongoDB infrastructure. We'll start here on the global view of Foglight which, as you can notice, across our entire database environment gives us a single pane of glass across each platform that we manage.
The tiles at the top of the screen let us focus in on specific platforms, such as SQL Server, PostgreSQL, or of course MongoDB, but also being able to zoom out and see all of our database servers in a single view. The heat map visualization below allows us to intuitively understand the health of each database platform that we manage. The servers that are green represent themselves as small blocks in the lower right-hand corner of the heat map, and then as servers grow in size, change in color, and move themselves to the left, those are effectively servers that we think need your attention at a higher level of priority.
Focusing in on MongoDB, we can switch to our tabular view and see that information in more detail, including the alarms that are active, indicating the health issues related to our systems. What's responsible for determining health of a MongoDB environment, our set of out-of-the-box alarms that Foglight can raise. Foglight ships with roughly 50 or so out-of-the-box alarms that can indicate a potential issue with MongoDB.
Each alarm can be customized to meet specific requirements that the customer may face, and of course, you can also build your own custom alarms should you see fit. But the alarms in general will cover a wide range of issues around MongoDB availability, replica set health, collection size, and document growth, index consumption, memory consumption, and query performance. So the out-of-the-box alarms that Foglight for MongoDB provides can each be customized. You can turn off alarms that you don't need. You can also configure the thresholds that alarms are evaluated against so that they are more or less sensitive in your particular environment.
In response to alarms, you've seen the visualization that we provide in the Foglight dashboards. Foglight also provides direct email notification should you want to be emailed when a particular alarm occurs at a specific severity, as well as Foglight provides integration options so that MongoDB-specific alarms can be sent directly to some other third-party solution. Perhaps your organization uses a third-party product for incident management or enterprise monitoring, Foglight provides several integration options so that its alarms can be sent directly over to any other third-party solution.
Jumping back into Foglight, specifically looking at our MongoDB infrastructure, you can see that Foglight fully supports and provides visibility into the three different deployment strategies for MongoDB. The top entry here you'll see represented by a standalone single MongoDB database, the second entry here showing a replica set, specifically in our case a three node replica set, and the third option here showing a fully sharded cluster in MongoDB. In my example, I have three shard servers, each represented as a replica set, a config server, and several mongoses.
So really, from the top down centralized perspective, Foglight can give you broad insight into the overall health of your entire MongoDB deployment, regardless of how you have deployed the MongoDB databases in your infrastructure. This global view also does a nice job at providing high level details about the overall infrastructure, an inventory of the versions that you're managing, MongoDB's uptime, some general counters around workload, as well as resource utilization over towards the right, so you can globally view the resource utilization of your MongoDB infrastructure.
Now from here, so far we've been focused on that centralized visibility into the health of our MongoDB deployment. Once we understand that there might be an issue, or perhaps if one of our users has asked us to troubleshoot an issue, we can now switch into more diagnostics mode in Foglight. And we're going to do that by leaving the global view and drilling in to a particular component of our Mongo infrastructure. And the dashboards presented will be dependent on the level of the infrastructure that we drill in at.
For example, let's say we're using a sharded cluster in MongoDB. If we click on the cluster level, we'll see a top-down view focused on the overall health and status of the cluster as a whole. And you'll see in this view, we've dynamically laid out all of our mongoses, our config servers, and each of our shard servers here with the replica set configuration of each. You'll also see, as I scroll down in this cluster view, a summary of databases and collections that exist across this MongoDB cluster. Drilling in at the replica set level will give us a top-down look at the health and configuration of our replica set. Again, in this case, a three node replica set highlighting the configuration status of each replica set member with also some health metrics around the health of the replica set and any latencies that might exist between members.
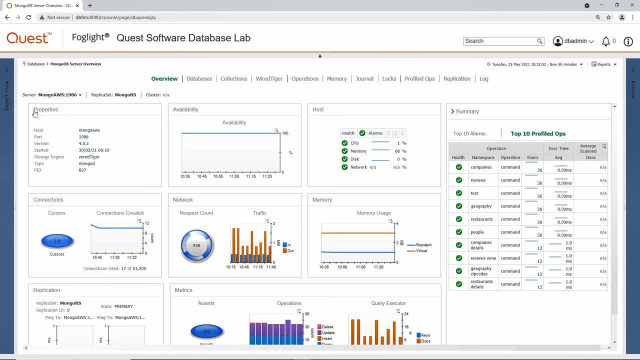
And lastly, drilling into an individual component or an individual MongoDB server, whether it's a standalone database or a member of the replica set, brings us now into a database-specific view focused on the health of this individual MongoDB system that makes up our environment. In our case, I'm currently looking at one node of a replica set. You'll see we start you with an overview perspective focused on high level health. You can see the overview broken into sections focuses on general properties, availability of the MongoDB database, as well as some host-level resource utilization metrics.
Scrolling down, we'll see statistics around connections network metrics, memory metrics, and also metrics related to query performance. Also, you can see high-level details about your replication configuration. Again this node, as a component of a replica set, we can see the status or the state of this particular replica set member as well as ping times to each additional replica set member in our configuration.
Lastly, over towards the right-hand side of the screen, you'll see a summary of the alarms that have been raised on this particular MongoDB database as well as our top 10 profiled operations, or what many customers would call commands or queries, that are currently running on this MongoDB database. This overview screen is generally used for that first-level diagnostics where we just want a brief summary of what's occurring on the instance of MongoDB. And then you'll see drilldown tabs across the top of the screen where we can drill deeper into a specific aspect of the MongoDB database. For example, in this case we may have multiple databases on a single node of our MongoDB replica set. The database's drilldown will show us information about each database that exists on this node.
Now in general the Foglight dashboards are going to be represented by default in a real-time or recent time range, but you will see a control at the top right-hand corner of the screen that allows you to zoom in, zoom out, or also go back in time to troubleshoot historical issues. For example, rather than looking at the last hour's worth of database information, maybe I want to look at a full week's worth of database information. We can simply zoom out to seven days, and now the metrics and graphs that we see are reflective of that longer-term time range.
Maybe there's an example where I wanted to troubleshoot an influx of documents coming into our reviews database. We can select the reviews database and now see trended information about operational statistics, such as size and document counts, as well as the operations that are occurring against that particular database. The Collections drilldown is similar but, of course, focuses on collection statistics.
We navigate into our Collections drilldown, again, using a specific time range as reference. We can see all of the collections that exist on a particular MongoDB database. Drilling into a collection will allow us to view more details, including information about how the collection may or may not be sharded. In this case, I'm looking at a standalone replica set, but if I was looking at a sharded cluster it might be useful to drill into a particular collection, view the rate of growth of that collection over any specific time range, as well as scrolling down to look at the status of sharding within the particular collection itself.
The WiredTiger drilldown is a useful drilldown for understanding the fairly complex MongoDB storage engine. What I like especially in this drilldown is that, while we provide very deep insight into metrics that are captured across each of these storage engine tabs, the blocks at the top of the screen with health indicators represent the overall health of each component that makes up the storage infrastructure. So rather than diving straight into metrics themselves, I can simply see are all the components of the storage engine specifically WiredTiger functioning properly. Or if there was an issue with caching, we might see a health indicator here, and that would give us some insight to drill down on that particular component.
I'll skip across a few tabs, though, and drill straight into this Profiled Operations tab. Many of our customers are going to want to understand what are the queries and commands captured by the MongoDB profiler with their specific resource consumption. And that's exactly what this drilldown would provide. We can pick a particular command or query, we can see the aggregate performance of that query in the table above, maybe allowing us to sort by execution counts or average response times, and then see detailed performance metrics about this particular query in the list below.
Lastly, I'll end on the Replication drilldown, MongoDB replica sets being a core component of how MongoDBs are kept highly available. The replica set drilldown here will show us the status of the replica set as well as latency and oplog-specific metrics related to replica set synchronization over any time range that I'm displaying the dashboard over. We can use these dashboards or drilldowns interactively to diagnose and solve problems within our MongoDB infrastructure by changing the time. All of the data presented is also available to be exported in an ad hoc fashion.
Let's say I want to send this list of top profiled operations or databases over to a developer for analysis. I can export the list right from Foglight itself, and then also, out-of-the-box reports are provided, which can be scheduled or automated. So after a database administrator or developer has perhaps solved the problem, you may decide to set up a reoccurring and scheduled health check report to be sent off to an application owner so that this user can receive this information maybe on a weekly or a monthly basis, directly delivered to their inbox.
So that's a quick summary of how Foglight for Databases can help provide insight into a database environment, again, with a specific focus on the MongoDB database. Hopefully this was useful and for more information, please navigate to the Quest website where you can view more information about Foglight as well as download a trial for yourself. Thanks for your time today. Take care.
 11:15
11:15