
A SQL Server execution plan is useful for investigating performance issues with your queries. Database professionals often receive trouble tickets or user complaints that queries are running slowly. Query results that used to take two or three minutes suddenly require more than 30 minutes. Troubleshooting may require investigating areas such as server resources (CPU, memory), statistics, disk performance, blocking, deadlocks and indexes. In this article, we’ll focus on the role of the SQL Server execution plan in solving performance problems.
What happens once you submit T-SQL in SQL Server?
Let’s look at what happens once you submit a query using Transact-SQL, or T-SQL, in SQL Server. To users, of course, it makes no difference. Users expect to get accurate results quickly, whether querying the database or searching the web.
The high-level workflow of a SQL query
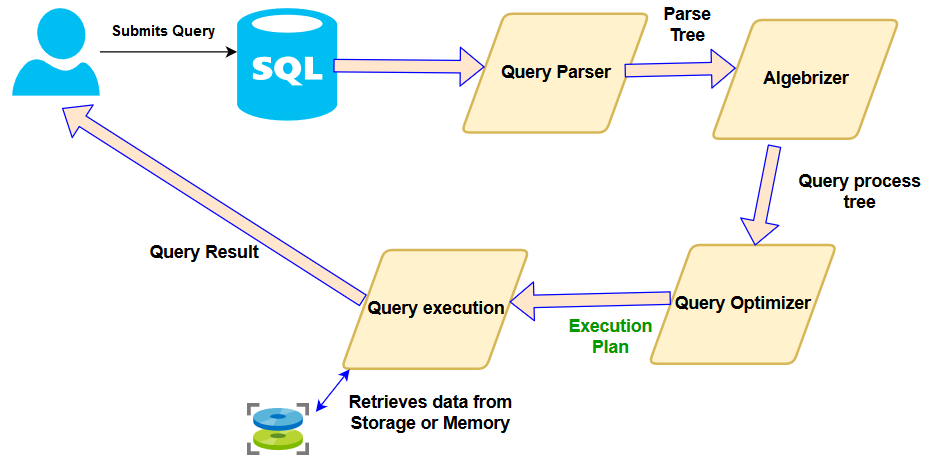
- User authenticates to SQL Server in a client application and submits a query.
- SQL Server parses the query and checks for any syntax errors.
- The parse tree is processed further in Algebrizer, which resolves all objects, tables and columns in the query. It also performs a check on the column data types. In case of any issues, it returns an error. Algebrizer generates a query process tree and a query hash. If the execution plan already exists, SQL Server uses that cached plan and executes the query.
- If no plan exists or the plan is obsolete, the Query Optimizer performs a full cost-based optimization with the help of statistics, query process tree and constraints. Based on those inputs, it prepares the cost-optimized SQL Server execution plan.
- Finally, the SQL Server query engine executes the query according to the execution plan and returns the results.
Overview of a SQL Server execution plan
A SQL Server execution plan helps database professionals troubleshoot query performance and write efficient queries. When a query takes a long time to run, the SQL Server execution plan can help you identify the point at which the query is taking the most resources and time.
You can use any of the following to generate an execution plan:
- SQL Server Management Studio
- Azure Data Studio
- SQL Server profiler
- Extended events
- Dynamic management views
- Third-party database monitoring software
The execution plans generated by #1 through #5 are similar. Third-party database monitoring software (#6) provides additional functions that use color coding to identify costly operators.
SQL Server provides estimated and actual execution plans, similar to what you experience when you need to repair your car. A mechanic inspects your vehicle, then you receive an estimate of the work based on your requirements, the vehicle condition and the approximate time and materials the mechanic thinks the repair will take. Of course, the actual cost and time may differ, as it does with estimated and actual SQL Server execution plans.
Estimated execution plans
Without executing the query, you can obtain an estimated (logical) SQL Server execution plan based on SQL Server statistics. In SQL Server Management Studio (SSMS) follow these steps:
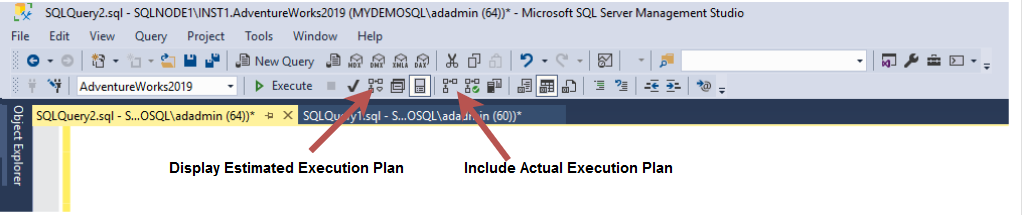
- Highlight the query (in case you want the execution plan for a specific query).
- Click on the Display Estimated Execution Plan button (keyboard shortcut Ctrl + L), as shown below.
Sometimes SQL Server is unable to produce an estimated plan; for example, if a parameter is used without specifying its value in the query, or if a temp table is not declared.
Actual execution plan
Once you submit the query to SQL Server, you can obtain an actual execution plan representing the steps that SQL Server took to execute the query. As in the vehicle repair scenario, this is like the actual bill you receive.
To get the actual execution plan, follow the steps below in SSMS before running the query.
- Highlight the query.
- Click on the Display Actual Execution Plan button (keyboard shortcut Ctrl + M), as shown above.
SQL Server execution plan formats
By default, the SSMS procedures explained above generate a SQL Server execution plan in graphical format. But you have the option of viewing execution plans in three different formats:
- Graphical
- XML
- Text
Let’s look at each of those formats.
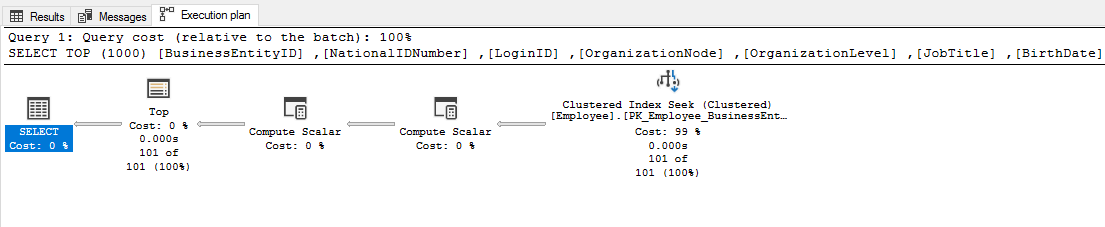
1. Graphical execution plan
The graphical plan depicts all components, including data flow, as shown below.
Operators
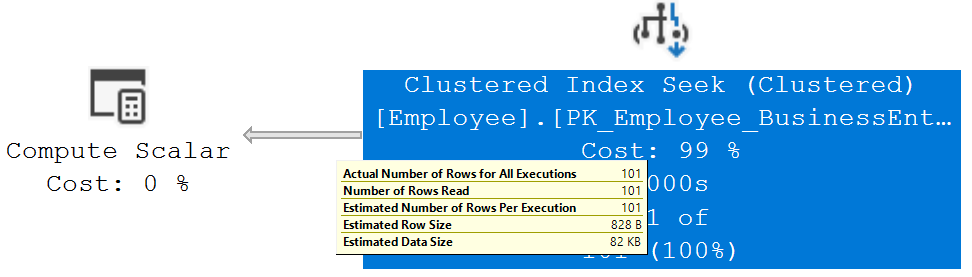
Operators are displayed as icons. Each operator is designated to perform a specific task. For example, the query optimizer in SQL Server might perform a table scan, an index scan and a seek. This is how a clustered index seek operator looks as it pulls data from an index on the [AdventureWorks2019].[HumanResources] table:
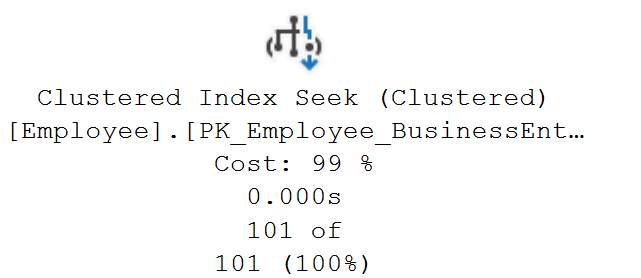
Percentage cost
The graphical plan also shows a percentage cost — here, 99% for the clustered index seek — associated with the operator. That cost is relative to the other operators used in executing the query.
Data flow arrows
Arrows connect the operators, their width reflecting the number of rows of data moving from one operator to the next.
For instance, suppose your query generates only a single row of output but takes a long time to complete. Moving the mouse to the data flow arrow in the execution plan, you find that the number of rows read is in the millions. That represents a huge imbalance in resource utilization and reveals an area in need of optimization.
Tooltips
As shown below, when you mouse over an operator, tooltips appear with more statistics on data flow.
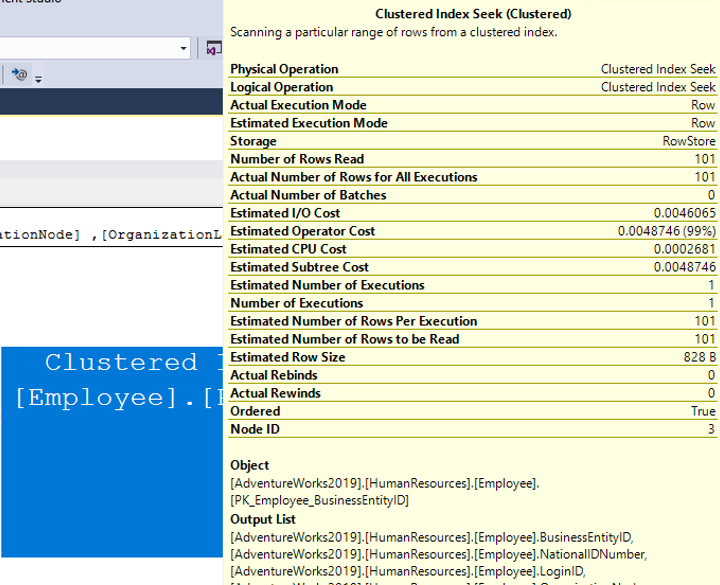
Properties window
The Properties window displays detailed information about the operators and their components. This is a superset of the tooltips.
2. XML-formatted SQL Server execution plan
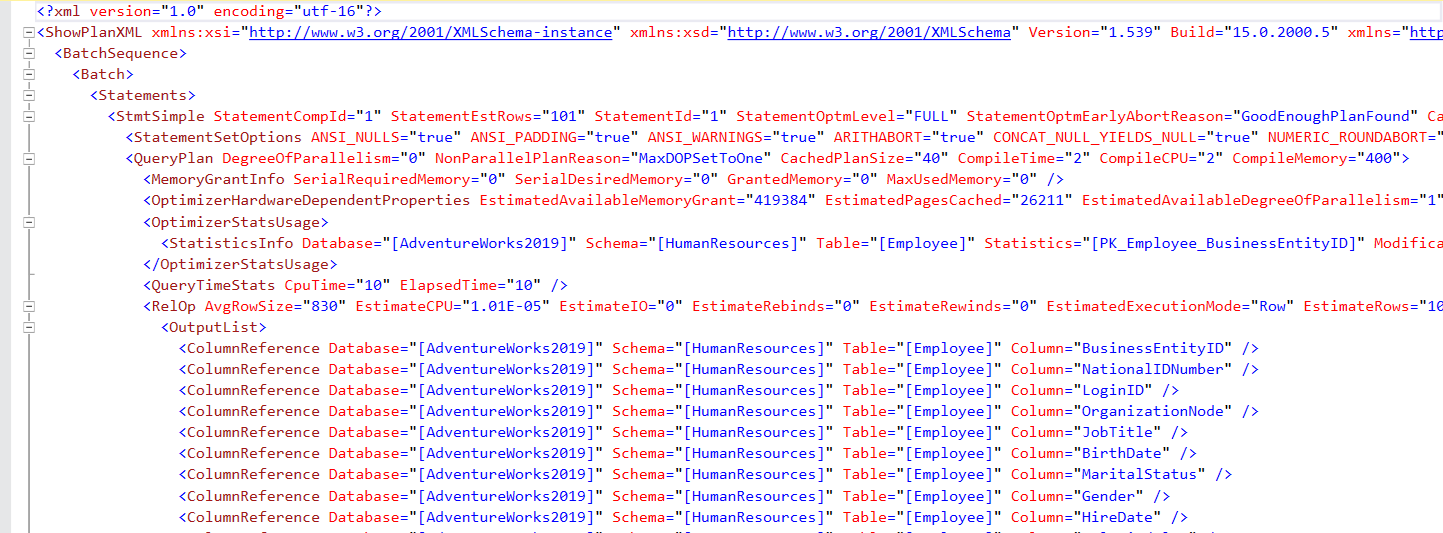
The XML execution plan is in a specific, structured format. Although the XML format is less visually intuitive, it holds all the details in XML and does not require additional steps to view properties and tooltips. You can easily convert XML format to graphical format and vice versa.
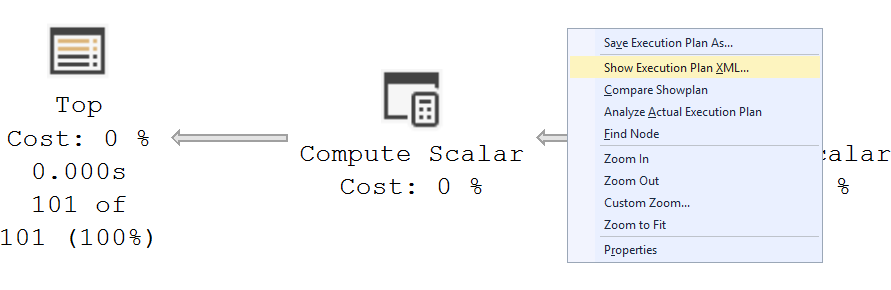
To convert a graphical execution plan into XML format, right-click on it and choose Show Execution Plan XML, as shown below.
The result is the following structured, XML-formatted execution plan.
The following commands also generate the execution plan in XML format:
- For the estimated plan: SET SHOWPLAN_XML ON
- For the actual plan: SET STATISTICS_XML ON
3. Text-formatted SQL Server execution plan
You can generate the execution plan in several ways:
- SET SHOWPLAN_TEXT ON
This command generates the estimated execution plan, without detailed information on query execution. It is intended for applications such as the sqlcmd utility.
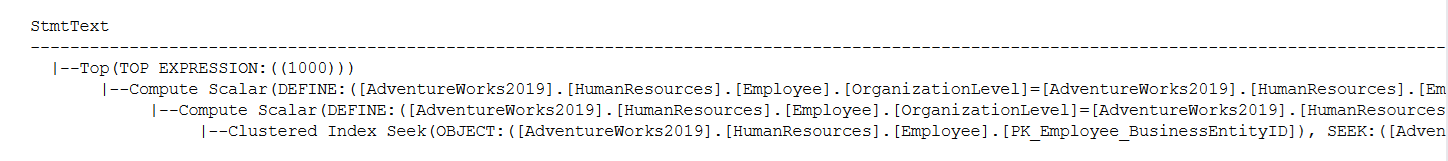
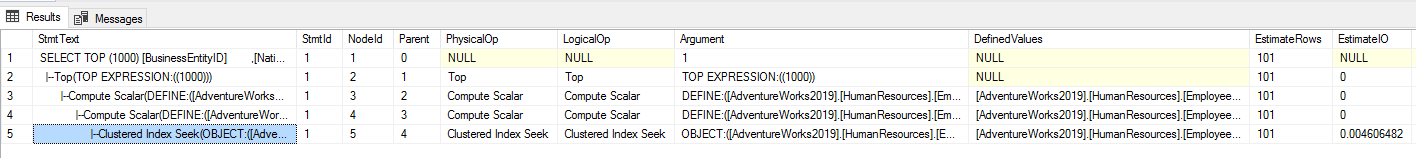
- SET SHOWPLAN_ALL ON
This command generates the estimated execution plan, with detailed information about all operators and operations in tabular format.
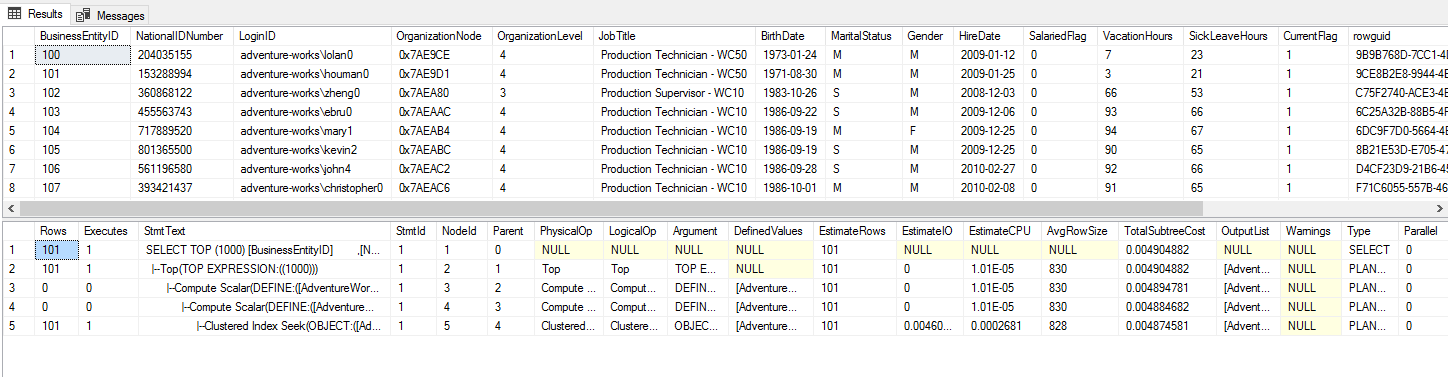
- SET STATISTICS PROFILE
This command generates an actual execution plan, after query execution, in tabular format.
Why are estimated and actual SQL Server execution plans different?
Estimated and actual execution plans are generally similar, though some circumstances may cause them to differ.
Stale statistics
The primary reason for differences between estimated and actual execution plans is stale statistics.
The query optimizer uses statistics to build a cost-effective and optimized query execution plan. If your statistics are not updated, or if your data sampling is not appropriate, query optimizer will perform a full optimization and build an execution plan based on old information. You can also get an inefficient execution plan that might lead to query performance issues.
Stale statistics sometimes occur when data changes frequently and statistics are not updated according to index maintenance.

Serial or parallel SQL Server execution plan
At compile time, the query optimizer builds an execution plan and produces a serial or parallel plan depending upon query cost and the cost threshold of parallelism. While the execution plan may be the same for both serial and parallel modes, SQL Server decides between them based on server resources and activity.
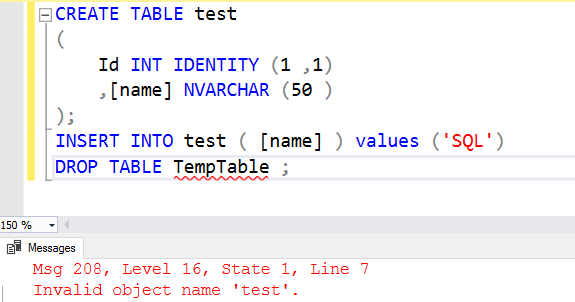
Invalid estimates
As mentioned earlier, Algebrizer binds the names of the objects before executing the SQL query. Suppose you specify that a table named test will be CREATEd at runtime, then try to generate an estimated execution plan. Because that table does not exist, you’ll receive an error message, as shown below.
Using the execution plan
In summary, you can generate a SQL Server execution plan in graphical, XML and text formats and use it to help you address your database performance issues.
Query execution plans are primary steps in identifying query workflow, operators and components so you can tune your queries for any possible improvement. For more information on using execution plans, check out our post: How to Read and Analyze Execution Plans.