Intro
This is a Step by Step guide to the creation of a dashboard that should show the status of all your FGLAMs in one place and display performance.
Steps
1. Under the Configuration Page select Definitions
2. Click the green + at the bottom to create a new module and call it "FGLAM Status". Ensure you select the relevant roles you require. If in doubt select all of them.
3. We now need to create 3 functions and 3 views within this module.
4. Select the newly created module and you should now have the option to add views and functions from the drop-down box in the menu below.
Functions
1. FQDNTokenized
Add a new function with type 'Script' and fill in the fields as follows:
Name: FQDNTokenized
Cache Results: Tick
Parameters: Name: name Data Type: Common:String
Output Data Type: Common:Object
Script Text:
return name.tokenize('.')[0].tokenize('-')[0]
Click Save at the top to save the function.
2. GetFglamClientInstances
Add a new function with type 'Script' and fill in the fields as follows:
Name: GetFglamClientInstances
Cache Results: Tick
Parameters: None
Output Data Type: Monitoring:FglamClientInstance
Output List: Tick
Script Text:
import groovy.time.*
now = new Date()
fglams = # !FglamClientInstance #.getTopologyObjects();
def output = []
for (fglam in fglams){
if (fglam.jvm){
lu = fglam.jvm.lastUpdated
duration = now.time - lu.time
if(fglam.agents.size() > 0 && duration < 259200000){
output.add(fglam)
}
}
}
return output.sort{it.jvm.lastUpdated}
Click Save at the top to save the function.
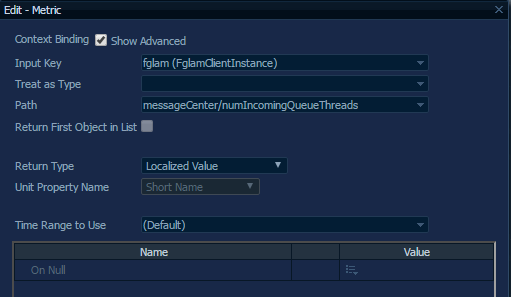
3. FglamSeverityMap
Add a new function with type 'Script with Map' and fill in the fields as follows:
Name: FglamSeverityMap
Cache Results: Tick
Parameters: Name: fglam Data Type: Monitoring:FglamClientInstance
Script Text:
import groovy.time.*
now = new Date()
lu = server.DataService.retrieveLatestValue(fglam.messageCenter, "numIncomingQueueThreads").getEndTime()
tl = 2400000
tl2 = 4200000
duration = now.time - lu.time
if(duration > tl2){
return "red"
} else if (duration < tl2 && duration > tl){
return "yellow"
} else {
return "green"
}
Map Input Data Type: Common:String
Output Data Type: Common:Severity
Map Entries:
| Key | Value |
| red | Fatal |
| green | Normal |
| yellow | Warning |
Note: The Key Value is "Set to String"
Click Save at the top to save the function.
Views
Now that our basic functions for the dashboard have been created we need to add our views. The three views we are going to create are in the table below.
| Name | Component | Purpose |
| FglamIncomingQueue | Time Plot Chart | Page, Pagelet, Portal, Portlet, Reportlet |
| Fglam Status | Iterator | Dashboard, Monitor, Page, Pagelet, Portal, Portlet, Reportlet |
| FglamStatusJellyBean | Metric Indicator | Monitor, Page, Pagelet, Portal, Portlet, Reportlet |
1. FglamIncomingQueue
Add the view using the table above to provide the General Details
Context:
| Key | Name | Usage | List | Data Type |
| timeRange | (not set) | Required | False | Common:Time Range |
| fglam | (not set) | Required | False | Monitoring:FglamClientInstance |
Configuration:
There are three configurations to make under this. Tick "Show Advanced Properties" at the top of the page.
Metric Data - Single Parent -
-Single Metric Bindings
-Single Metric Binding
-Metric
-Metric Label : String : "Incoming Queue"
-Legend Label : String : "Incoming Queue"
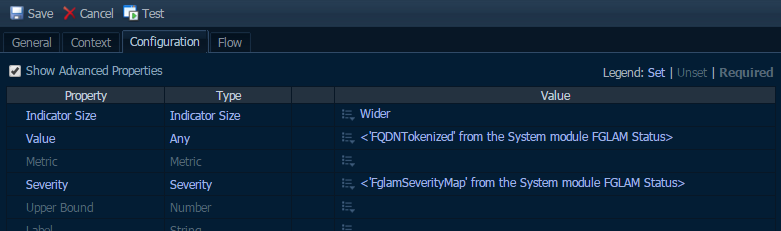
2. FglamStatusJellyBean
General Tab: Set the 'Refresh Interval' to 30 seconds
Context:
| Key | Name | Usage | List | Data Type |
| timeRange | (not set) | Required | False | Common:Time Range |
| fglam | (not set) | Required | False | Monitoring:FglamClientInstance |
Configuration:
| Property | Type | Value |
| Indicator Size | Indicator Size | Wider |
| Value | Any | FQDNTokenized |
| Severity | Severity | FglamSeverityMap |
Flow:
| Flow Type | Details | |
| Selection | Popup | Host Summary with Status |
| Dwell | Popup | FglamIncomingQueue |
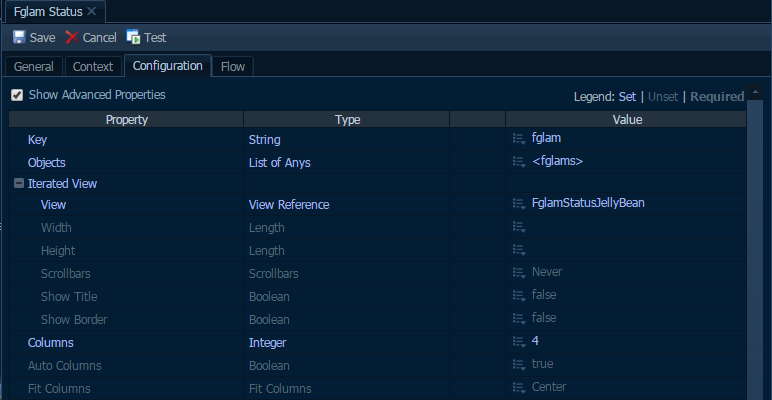
3. Fglam Status
General Tab: Ensure 'Public' is Ticked and 'Refresh Interval is 30 seconds
Context:
| Key | Name | Usage | List | Data Type | Fallback Value |
| timeRange | (not set) | Required | False | Common:Time Range | |
| fglam | (not set) | Optional | True | Monitoring:FglamClientInstance | Function Binding: FglamClientInstances |
Configuration:
| Property | Type | Value |
| Key | String | fglam |
| Objects | List of Anys | <fglams> |
| +Iterated View | ||
| View | View Reference | FglamStatusJellyBean |
| Columns | Integer | 4 |
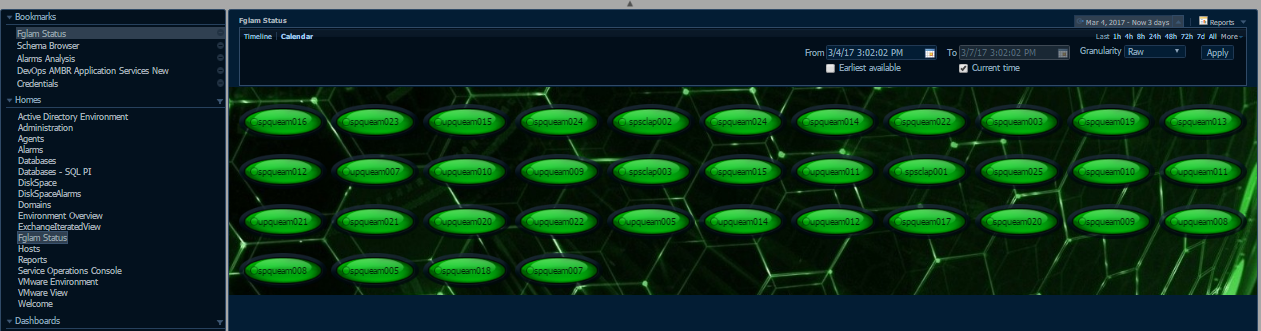
Save all of your work and now enjoy your new Fglam Status Dashboard.
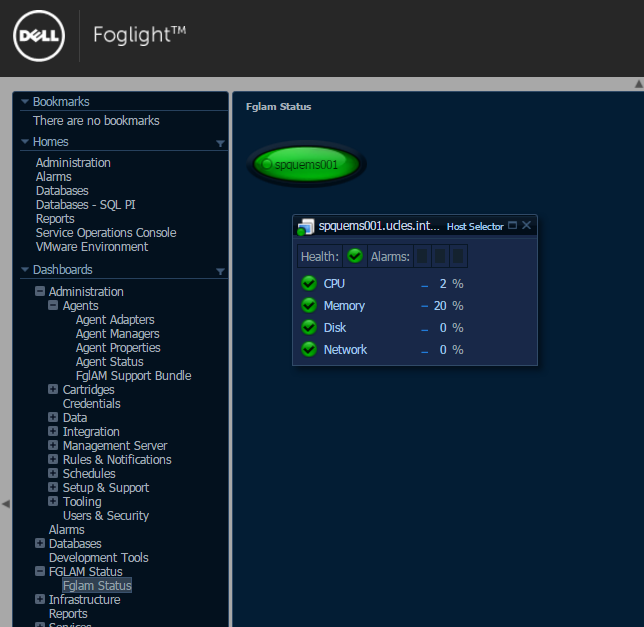
- If you click on a JellyBean it should show the Host Status
- If you hover over a JellyBean it should show the Fglam Incoming Queue
- Any new Fglams that are added to the FMS should automatically be added to this dashboard for you
- You can even add a fancy background if you like as below.