
Foglight for SQL Server Business Intelligence (BI) provides analysis monitoring for SQL Server BI services: Integration services, Reporting services, and Analysis services.
In this (Part 3) blog, the focus is SQL Server Analysis Services or ‘SSAS’.
SSAS is an analytical data engine. It’s a tool to allow users to efficiently mine and analyze data often spread across disparate sources. It is important to monitor SSAS to ensure high availability and peak performance of the related queries.
Foglight supports monitoring both Multi-Dimensional and Tabular models.
This blog reviews the steps to configure an instance to monitor and the metrics and alarms provided in the various dashboards.
Note: For more details than what is covered in this blog, reference the Foglight for SQL Server User Guide here -> https://support.quest.com/technical-documents/foglight-for-databases/5.9.2/user-guide
This is the latest version of the guide (as of the publish date of this blog) and you'll need access to the Quest Support site.
** Foglight for Analysis Services monitoring is bundled with Foglight’s Performance Investigator.
Once registering the Analysis Service connection, a Performance Investigator repository creation will be initiated.
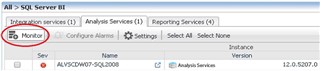
Choose the ‘Monitor’ button and enter the server name.
*(Click on the images to enlarge)
Enter login credentials, choose name generation, and enter o/s credentials.
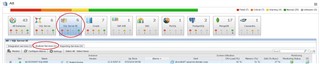
From the Databases dashboard, choose the SQL Server BI tile, then click on the Analysis services tab.
The Database home page displays the Instance name, version, last restart, the number and severity (color) of alarms firing against it, and system utilization counters.
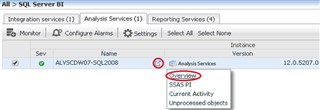
To the right of the instance name, click on this icon 
This Quick Link menu displays drill-down options: Overview, SSAS PI, Current Activity, and Unprocessed Objects.
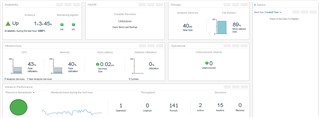
Overview dashboard:
Select Overview.
Across the top in a grey bar, you’ll see summary configuration information.

The Overview dashboard is organized by tiles. Each tile is labeled with what is being monitored and relevant alarms are displayed. The following are the tiles in the Overview dashboard:
Availability state
HA/DR – (Currently) there is no HA-related data. DR references the backup commands collected by Performance Investigator
Storage –Estimated spaced used by SSAS databases vs total instance space
Infrastructure –
CPU - Analysis service CPU utilization vs the instance
Memory – Analysis service memory usage vs total server memory
Disk I/O – Slowest disk latency
Network – Server network pressure
Operational – Number of Unprocessed objects (up to 500)
Performance – A resource breakdown of CPU usage and associated Wait States, Throughput volume, and Sessions activity.
There is an Alarms panel on the far right side that displays the active alarms.
These can be sorted by the time they first fired or by severity.
From the top of the Overview dashboard, select Current Activity.
The Current Activity dashboard summarizes the states of current sessions.
The information displayed includes the number of sessions active/inactive/blocked, throughput, resources used (memory, CPU), session SPID, username, status, CPU time, number of reads/writes, elapsed time, the command syntax, and its start time.
Refresh interval options are available in the top right corner in blue.
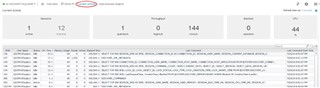
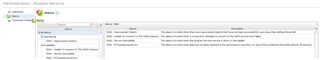
From the top of the Current Activity dashboard, select Unprocessed Objects.
The Unprocessed Objects dashboard lists those objects that cannot be accessed because they are in an unprocessed state. The list renders ‘on demand’ so expect some latency. This dashboard displays the path, object type, data source, and when it was last processed. A search field is available in the top right to find particular objects more easily.
*(This particular screenshot shows no unprocessed objects.)

Perhaps the most compelling dashboard is the SSAS PI dashboard.
From the Unprocessed Objects dashboard, select SSAS PI.
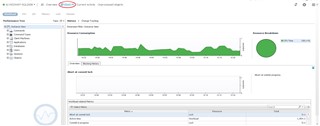
Across the top, you’ll see the Resource toolbar…
Choosing one of these filters the PI data to display information specific to that resource consumption type.

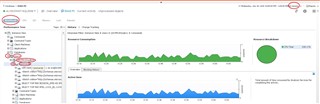
The Performance Tree allows for drilling into various data dimension to correlate the data. Upon expanding a ‘data dimension’ node, items will be listed in order of most to least for the resource consumption chosen. Use this in conjunction with the Historical Time options (Timeline or Calendar), located at the top right side of the PI interface, to filter the data for that window of time.
(Data is pulled from the PI repository.)

So, here’s an example…
(Always starting at the ‘Instance’ level), with Workload (default) highlighted, drill into ‘Users’, then drill into ‘Commands’ under that listed user.
With just those clicks, you’re now looking at the commands from that user that are workload-intensive against that instance in the past 60 minutes (default).
The center area displays charts with a color-coded breakdown of resource consumption over time.
Click on the Change Tracking tab to view change events over time.
Color-coded dots on the graph represent the change events.
Metadata – Changes to the Analysis Services server configuration and the underlying database schema.
System Configuration – o/s and hardware changes (e.g. disks)
User-Defined – Manually track any custom change (via Add Change button, left)
View the change event details in the bottom section including date/time, change description, change event category, and old and new value.
![]()
To view the Alarms available in Foglight for SSAS, from the Database Home page, check the box to the left of the instance and choose the Configure Alarms button.
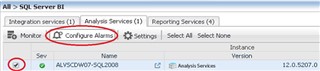
Available SSAS Alarms:
Monitoring SSAS with Foglight allows users to keep track of the performance of users’ SSAS commands and maintain peak health of the SSAS environment.
For more information, visit Foglight database monitoring to download a free trial.
